
DevOps
OpenTelemetry Instrumentation for Node.js
A hands-on guide to instrumenting Node.js with OpenTelemetry: traces, metrics and logs via auto-instrumentation, custom spans, context and exporters.
·4 min read
Tags
19 articles · Page 2 of 2
A hands-on guide to instrumenting Node.js with OpenTelemetry: traces, metrics and logs via auto-instrumentation, custom spans, context and exporters.

How to implement structured logging that makes production debugging fast: JSON formats, context propagation, log levels, data masking and aggregation.

How to build a complete observability stack, connecting distributed traces, structured logs and metrics to debug production faster than monitoring alone.
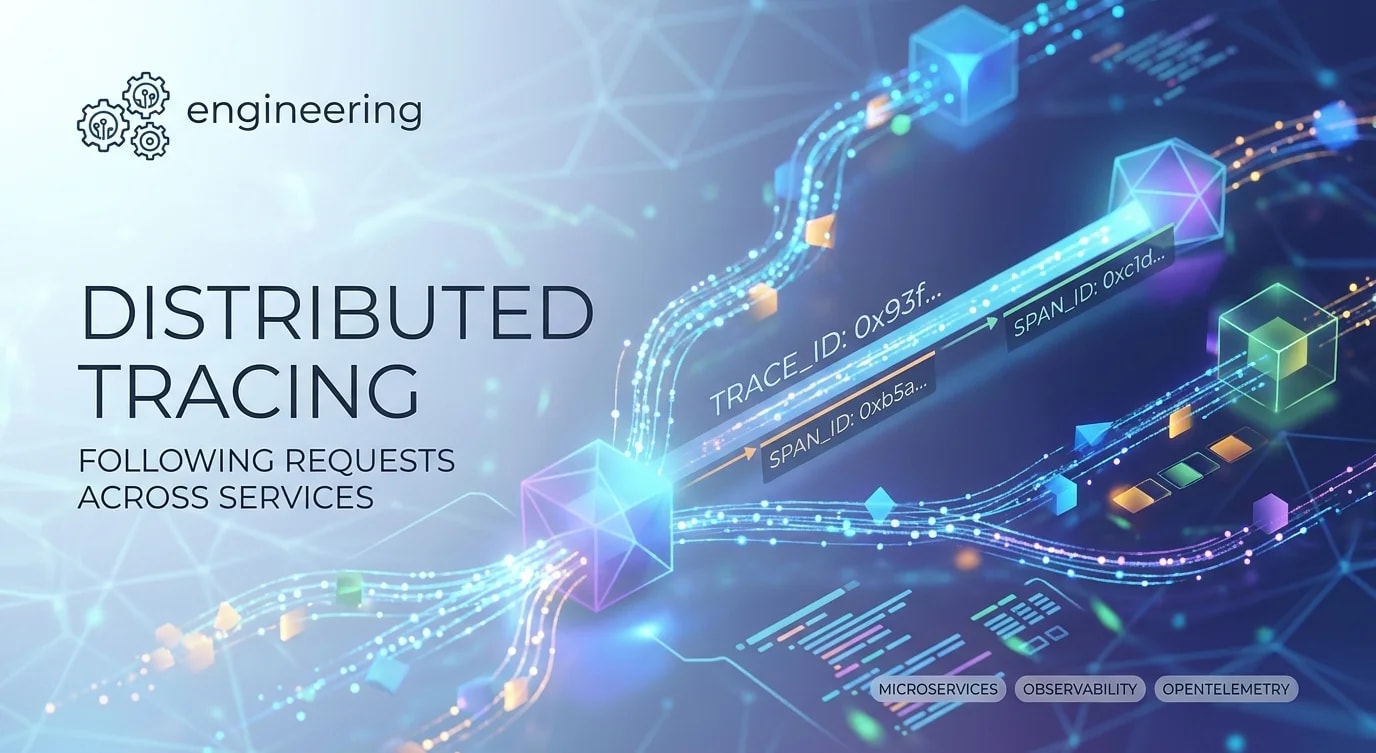
When a request touches five services, each log is useless alone — distributed tracing ties them together with trace IDs, spans and context propagation.

Service Level Objectives turn vague reliability goals into measurable contracts: how to define SLIs, set SLOs and use error budgets to balance velocity.
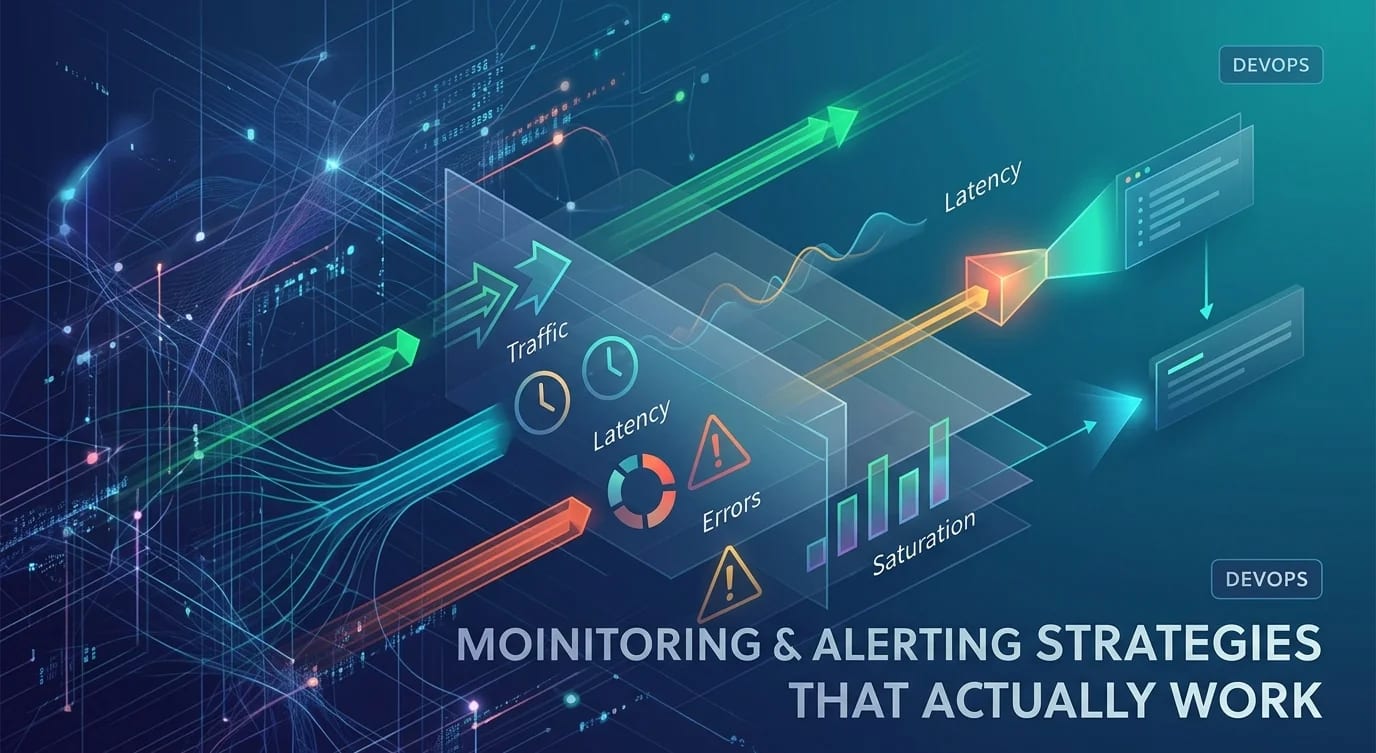
Alert fatigue kills incident response — build a monitoring strategy around SLIs, meaningful thresholds, and actionable alerts instead of noisy dashboards.
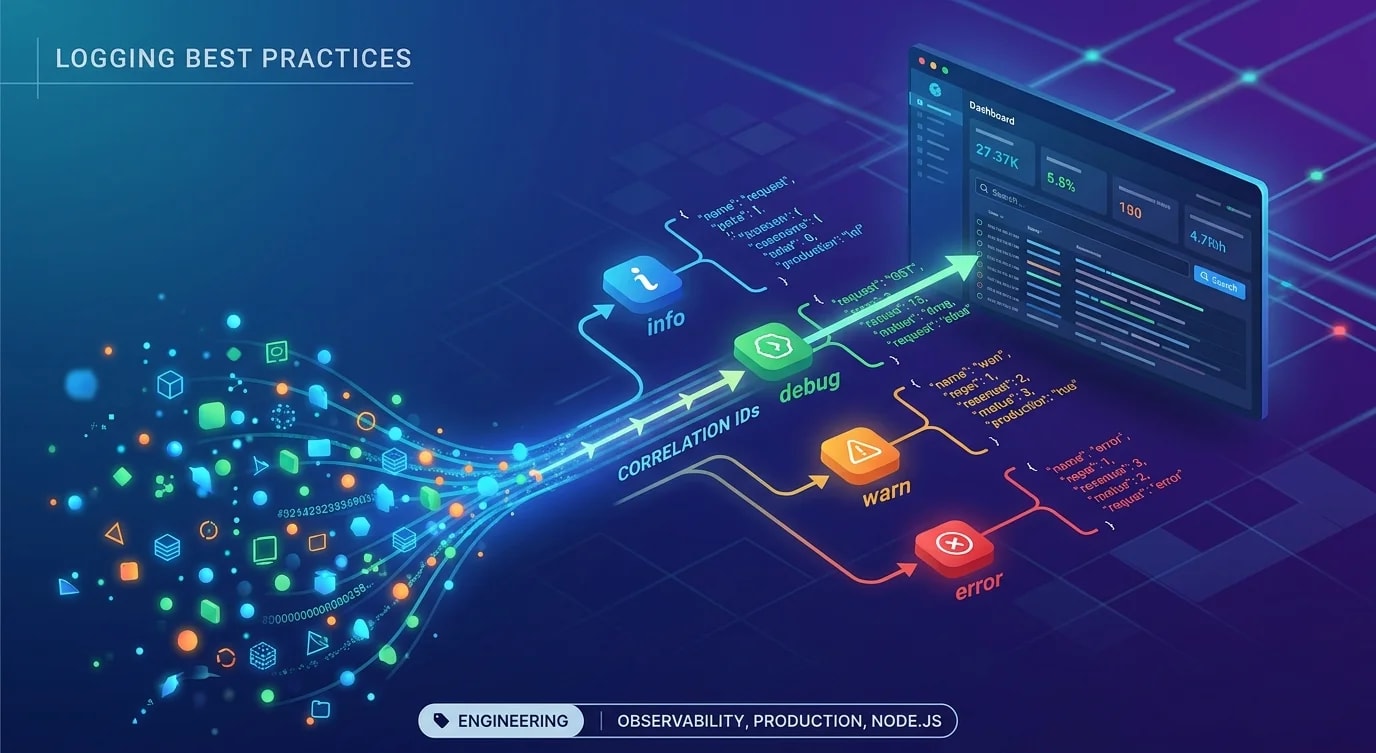
Structured logging, log levels, and correlation IDs — the patterns that turn noisy log output into a searchable, actionable observability layer.