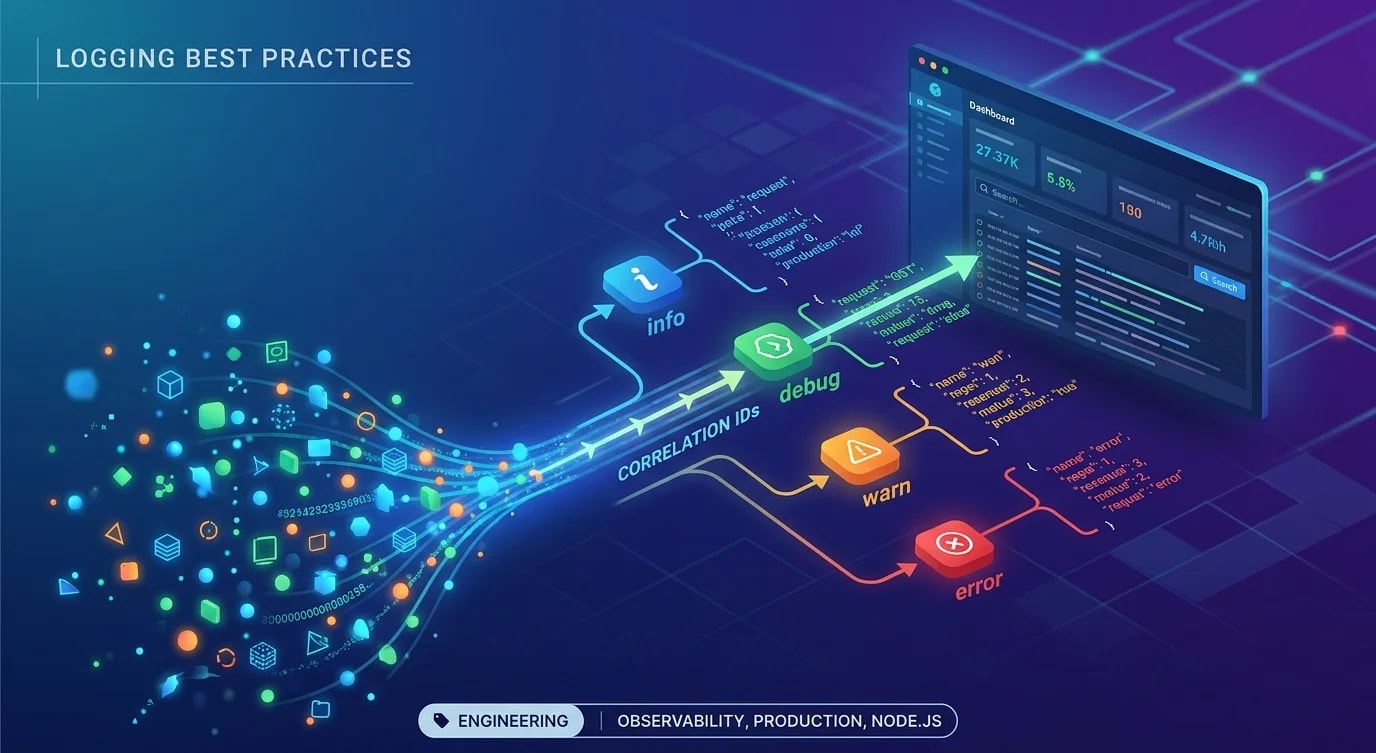
Structured Logging for Production Applications
How to implement structured logging that makes production debugging fast: JSON formats, context propagation, log levels, data masking and aggregation.

Unstructured logs are text strings that humans wrote for humans to read. They work in development. In production, with thousands of requests per second across dozens of services, searching through plain text logs is like looking for a needle in a field of haystacks. Structured logging produces machine-parseable output — typically JSON — that log aggregation tools can index, search, filter, and visualize.
The switch from console.log('User login failed') to structured JSON logs is one of the highest-leverage changes you can make for production operability.
Why Structure Matters
The fundamental problem with unstructured logs: you cannot reliably extract information from free-form text. Different developers format messages differently. Key values are embedded in prose. Searching requires regex patterns that break when the message format changes.
// ❌ Unstructured logging — text you can't reliably parse
console.log('User login failed for user@example.com from IP 192.168.1.1');
console.log(`Order #${orderId} processed in ${duration}ms`);
console.log('Cache miss for key: user:123:profile');

// How do you search for "all login failures from IP 192.168.1.x"?
// How do you graph order processing time over the last hour?
// How do you alert when cache miss rate exceeds 50%?

// ✅ Structured logging — machine-parseable JSON
logger.warn('User login failed', {
  event: 'auth.login_failed',
  email: 'u***@example.com', // Masked sensitive data
  ip: '192.168.1.1',
  reason: 'invalid_password',
  attemptCount: 3,
});

logger.info('Order processed', {
  event: 'order.processed',
  orderId: 'ord-abc123',
  durationMs: 247,
  itemCount: 5,
  totalAmount: 129.99,
});

// Now: search `event:auth.login_failed AND ip:192.168.1.*`
// Now: graph avg(durationMs) WHERE event:order.processed GROUP BY 1m
// Now: alert when count(event:cache.miss) / count(event:cache.*) > 0.5
Setting Up a Structured Logger
Build on a logging library that outputs JSON natively. Pino is the fastest Node.js logger. Winston is more configurable. Both support structured output.
// Using Pino — fast JSON logger
import pino from 'pino';

const logger = pino({
  level: process.env.LOG_LEVEL || 'info',
  formatters: {
    level: (label: string) => ({ level: label }),
  },
  timestamp: pino.stdTimeFunctions.isoTime,
  base: {
    service: 'payment-service',
    version: process.env.APP_VERSION || 'unknown',
    environment: process.env.NODE_ENV || 'development',
  },
});

// Output:
// {
//   "level": "info",
//   "time": "2022-01-05T14:30:00.000Z",
//   "service": "payment-service",
//   "version": "2.4.1",
//   "environment": "production",
//   "msg": "Order processed",
//   "orderId": "ord-abc123",
//   "durationMs": 247
// }// ❌ Creating logger instances everywhere with inconsistent config
const log1 = pino({ level: 'debug' }); // Different level
const log2 = pino({ level: 'info' }); // Different level
const log3 = console; // Not structured at all
// ✅ Single logger factory with consistent configuration
// src/lib/logger.ts
import pino from 'pino';
export function createLogger(module: string) {
return pino({
level: process.env.LOG_LEVEL || 'info',
timestamp: pino.stdTimeFunctions.isoTime,
base: {
service: process.env.SERVICE_NAME || 'app',
module,
},
});
}
// Usage in any file:
// import { createLogger } from './lib/logger';
// const logger = createLogger('payment-handler');Context Propagation
The most valuable log entries include context about the current request — who made it, what trace ID it belongs to, and which downstream calls it triggered.
import { AsyncLocalStorage } from 'async_hooks';
import pino from 'pino';

interface RequestContext {
  requestId: string;
  userId?: string;
  traceId: string;
  spanId: string;
}

const contextStorage = new AsyncLocalStorage<RequestContext>();

// Child logger that automatically includes request context
function getLogger() {
  const baseLogger = pino({ level: 'info' });
  const context = contextStorage.getStore();

  if (context) {
    return baseLogger.child({
      requestId: context.requestId,
      userId: context.userId,
      traceId: context.traceId,
      spanId: context.spanId,
    });
  }

  return baseLogger;
}

// Middleware: set context for each request
function requestContextMiddleware(req: any, res: any, next: () => void) {
  const context: RequestContext = {
    requestId: req.headers['x-request-id'] || crypto.randomUUID(),
    userId: req.user?.id,
    traceId: req.headers['x-trace-id'] || crypto.randomUUID(),
    spanId: crypto.randomUUID(),
  };

  contextStorage.run(context, () => {
    next();
  });
}

// Now every log line in the request lifecycle includes requestId and traceId
// Deep in a service call:
function processPayment(orderId: string) {
  const logger = getLogger();
  logger.info({ orderId, step: 'payment.start' }, 'Starting payment processing');
  // Output includes requestId, userId, traceId automatically
}
Log Levels and When to Use Each
Using log levels consistently across a team requires explicit definitions — not just "error is bad and debug is verbose."
// Log level guidelines with examples
const LOG_LEVEL_GUIDE = {
  fatal: {
    description: 'Application cannot continue — process will exit',
    examples: [
      'Database connection pool exhausted, no recovery possible',
      'Required environment variable missing at startup',
      'Unrecoverable corruption in critical data',
    ],
    action: 'Page on-call immediately, investigate within minutes',
  },
  error: {
    description: 'Operation failed — requires attention but app continues',
    examples: [
      'Payment processing failed for a specific order',
      'Third-party API returned 500 after retries exhausted',
      'Database query failed with unexpected error',
    ],
    action: 'Aggregate and alert if error rate exceeds threshold',
  },
  warn: {
    description: 'Unexpected condition — not a failure but worth investigating',
    examples: [
      'Request took longer than expected (>2s) but succeeded',
      'Cache miss rate above normal threshold',
      'Deprecated API endpoint still receiving traffic',
    ],
    action: 'Review periodically, investigate if frequency increases',
  },
  info: {
    description: 'Significant business events — the story of what happened',
    examples: [
      'User created an account',
      'Order placed and payment confirmed',
      'Deployment completed successfully',
    ],
    action: 'Always on in production — the primary audit trail',
  },
  debug: {
    description: 'Detailed technical information for troubleshooting',
    examples: [
      'SQL query text and execution time',
      'Cache hit/miss for specific keys',
      'HTTP request/response details to external services',
    ],
    action: 'Off in production by default — enable temporarily to diagnose issues',
  },
} as const;// ❌ Logging everything at the same level
logger.info('Starting request');
logger.info('Database query failed'); // This should be error!
logger.info('Cache key not found'); // This is debug at most
// ✅ Consistent level usage
logger.info({ event: 'request.start', method: 'POST', path: '/orders' }, 'Request received');
logger.error({ event: 'db.query_failed', query: 'SELECT...', err: error.message }, 'Database query failed');
logger.debug({ event: 'cache.miss', key: 'user:123' }, 'Cache miss');Sensitive Data Masking
Production logs must never contain passwords, tokens, credit card numbers, or full personal identifiers. Mask or redact sensitive fields before logging.
// Sensitive field masking
const SENSITIVE_FIELDS = new Set([
  'password', 'token', 'accessToken', 'refreshToken',
  'authorization', 'cookie', 'creditCard', 'ssn',
  'secret', 'apiKey',
]);

function maskSensitiveData(obj: Record<string, unknown>): Record<string, unknown> {
  const masked: Record<string, unknown> = {};

  for (const [key, value] of Object.entries(obj)) {
    if (SENSITIVE_FIELDS.has(key.toLowerCase())) {
      masked[key] = '[REDACTED]';
    } else if (typeof value === 'object' && value !== null) {
      masked[key] = maskSensitiveData(value as Record<string, unknown>);
    } else if (typeof value === 'string' && key.toLowerCase().includes('email')) {
      // Partially mask email
      const [local, domain] = value.split('@');
      masked[key] = `${local[0]}***@${domain}`;
    } else {
      masked[key] = value;
    }
  }

  return masked;
}

// Pino serializer for automatic masking
const logger = pino({
  serializers: {
    req: (req) => ({
      method: req.method,
      url: req.url,
      headers: maskSensitiveData(req.headers),
    }),
  },
});
Key Takeaways
- Structured logs are machine-parseable — JSON format enables search, filtering, alerting, and visualization in log aggregation tools
- Use a single logger factory with consistent configuration — every log entry should include service name, version, and environment
- Propagate request context automatically —
AsyncLocalStorageensures every log line includes requestId and traceId without manual passing - Define log levels explicitly — fatal, error, warn, info, and debug each have specific criteria and operational actions
- Mask sensitive data before logging — passwords, tokens, and personal identifiers must never appear in production logs
- Keep info level as your audit trail — it should tell the story of what happened without drowning in technical details