Logging Best Practices for Production Systems
Structured logging, log levels, and correlation IDs — the patterns that turn noisy log output into a searchable, actionable observability layer.
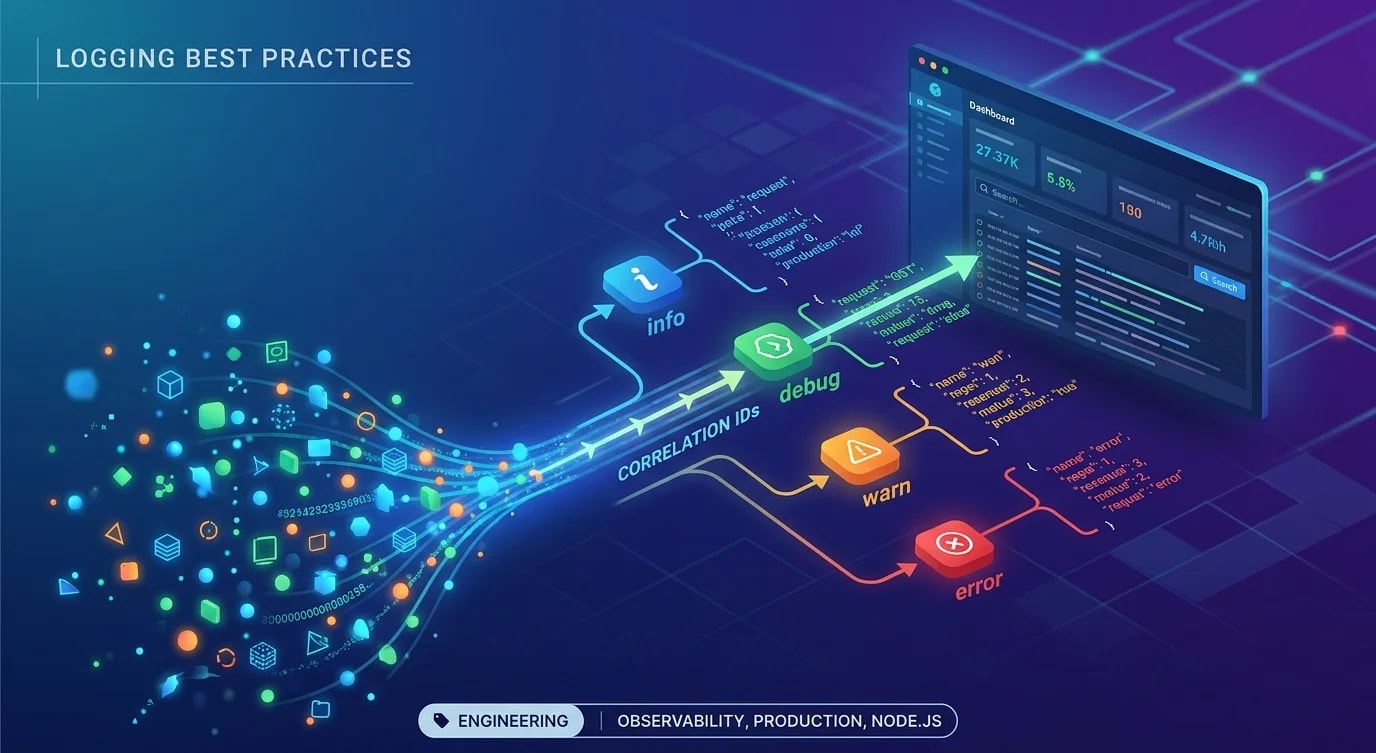
Most production logging falls into two categories: too much noise to be useful, or too little information to debug anything. Good logging is a design decision, not an afterthought. It requires choosing the right format, the right level, and the right context for every log statement.
Structured Logs Over Plain Text
Plain text logs are human-readable in a terminal and useless everywhere else. Log aggregation tools like Datadog, Elastic, and CloudWatch need structured data to filter, search, and alert on.
// ❌ Plain text — impossible to parse or filter at scale
console.log(`User ${userId} placed order ${orderId} for $${total}`);
// "User cust_123 placed order ord_456 for $99.50"

// ✅ Structured JSON — every field is searchable
logger.info("Order placed", {
  userId: "cust_123",
  orderId: "ord_456",
  total: 99.5,
  currency: "USD",
  itemCount: 3,
});
// {"level":"info","msg":"Order placed","userId":"cust_123","orderId":"ord_456","total":99.5,"currency":"USD","itemCount":3,"timestamp":"2020-02-19T14:30:00Z"}
With structured logs, you can query "show me all orders over $100 from user cust_123" without regex gymnastics.
Log Levels That Mean Something
Most teams use log levels inconsistently. Define clear semantics and enforce them in code review.
| Level | When to use | Example |
|---|---|---|
error | Something failed and needs human attention | Payment charge failed, database connection lost |
warn | Something unexpected but handled | Rate limit approaching, deprecated API called |
info | Significant business events | Order placed, user signed up, deployment started |
debug | Internal details for troubleshooting | Cache hit/miss, query timing, intermediate state |
// ❌ Wrong levels — error used for non-errors, info used for noise
logger.error("User not found"); // This is expected behavior, not an error
logger.info(`Cache key: ${key}`); // Debug-level detail flooding production

// ✅ Correct levels — each level has clear semantics
logger.warn("User not found", { userId, endpoint: "/api/profile" });
logger.debug("Cache lookup", { key, hit: false, latencyMs: 2 });
In production, set the minimum level to info. Enable debug temporarily when investigating a specific issue. Never run debug permanently — it generates too much volume and costs real money in log storage.
Correlation IDs for Request Tracing
When a single user request touches multiple services, correlation IDs tie the entire chain together.
import { randomUUID } from "crypto";

function requestIdMiddleware(req: Request, res: Response, next: NextFunction) {
  const requestId = req.headers["x-request-id"] ?? randomUUID();

  // Attach to response for client debugging
  res.setHeader("x-request-id", requestId);

  // Attach to request context for downstream logging
  req.requestId = requestId;

  next();
}// Every log in the request lifecycle includes the same correlationId
function createRequestLogger(requestId: string) {
return {
info: (msg: string, data?: Record<string, unknown>) =>
logger.info(msg, { ...data, requestId }),
warn: (msg: string, data?: Record<string, unknown>) =>
logger.warn(msg, { ...data, requestId }),
error: (msg: string, data?: Record<string, unknown>) =>
logger.error(msg, { ...data, requestId }),
};
}
// In a route handler:
app.post("/api/orders", async (req, res) => {
const log = createRequestLogger(req.requestId);
log.info("Order creation started", { userId: req.userId });
const order = await createOrder(req.body, log);
log.info("Order created", { orderId: order.id });
await chargePayment(order, log);
log.info("Payment charged", { orderId: order.id });
res.json(order);
});When something fails, search by requestId to see the complete request timeline across all services.
What to Log (and What Not To)
Always log
- Request start and end (with duration)
- Business events (order placed, payment processed, user action)
- Errors and exceptions with full stack traces
- External API calls (with response time and status)
Never log
- Passwords, tokens, API keys, or secrets
- Full credit card numbers or SSNs
- Request bodies containing sensitive user data
- Health check requests (they drown out real traffic)
// ❌ Logging sensitive data
logger.info("User login", { email, password: req.body.password });

// ✅ Redact sensitive fields
logger.info("User login", { email, passwordProvided: !!req.body.password });
Error Logging with Context
An error log without context is almost useless. Include everything needed to reproduce the issue.
// ❌ Bare error message — who was affected? What were the inputs?
logger.error("Payment failed");

// ✅ Full context — actionable without opening a debugger
try {
  await paymentGateway.charge(amount, paymentMethodId);
} catch (error) {
  logger.error("Payment charge failed", {
    userId,
    orderId,
    amount,
    paymentMethodId,
    gateway: "stripe",
    errorCode: error.code,
    errorMessage: error.message,
    stack: error.stack,
  });
  throw error;
}
The goal is that someone reading the log at 3 AM can understand what happened, who was affected, and what to investigate — without deploying new logging.
Performance Logging
Log slow operations proactively. Don't wait for users to report latency.
function withTiming<T>(
  name: string,
  fn: () => Promise<T>,
  log: Logger,
  thresholdMs = 1000,
): Promise<T> {
  const start = performance.now();

  return fn().finally(() => {
    const durationMs = Math.round(performance.now() - start);

    if (durationMs > thresholdMs) {
      log.warn("Slow operation detected", { operation: name, durationMs });
    } else {
      log.debug("Operation completed", { operation: name, durationMs });
    }
  });
}

// Usage
const users = await withTiming("getActiveUsers", () => getActiveUsers(), log);
This pattern surfaces performance regressions before they become incidents.
Key Takeaways
- Use structured JSON logs — plain text is unqueryable at scale
- Define log levels consistently — error means "needs human attention," not "something unexpected happened"
- Correlation IDs tie an entire request lifecycle together across services
- Never log sensitive data — passwords, tokens, and PII are security liabilities in log stores
- Include full context in error logs — make 3 AM debugging possible without code changes
- Log slow operations proactively — performance thresholds catch regressions early


