Debugging Distributed Systems: Correlation and Causation
Debug distributed systems with correlation IDs, tracing context propagation, log aggregation and causal ordering to follow a request to its root cause.
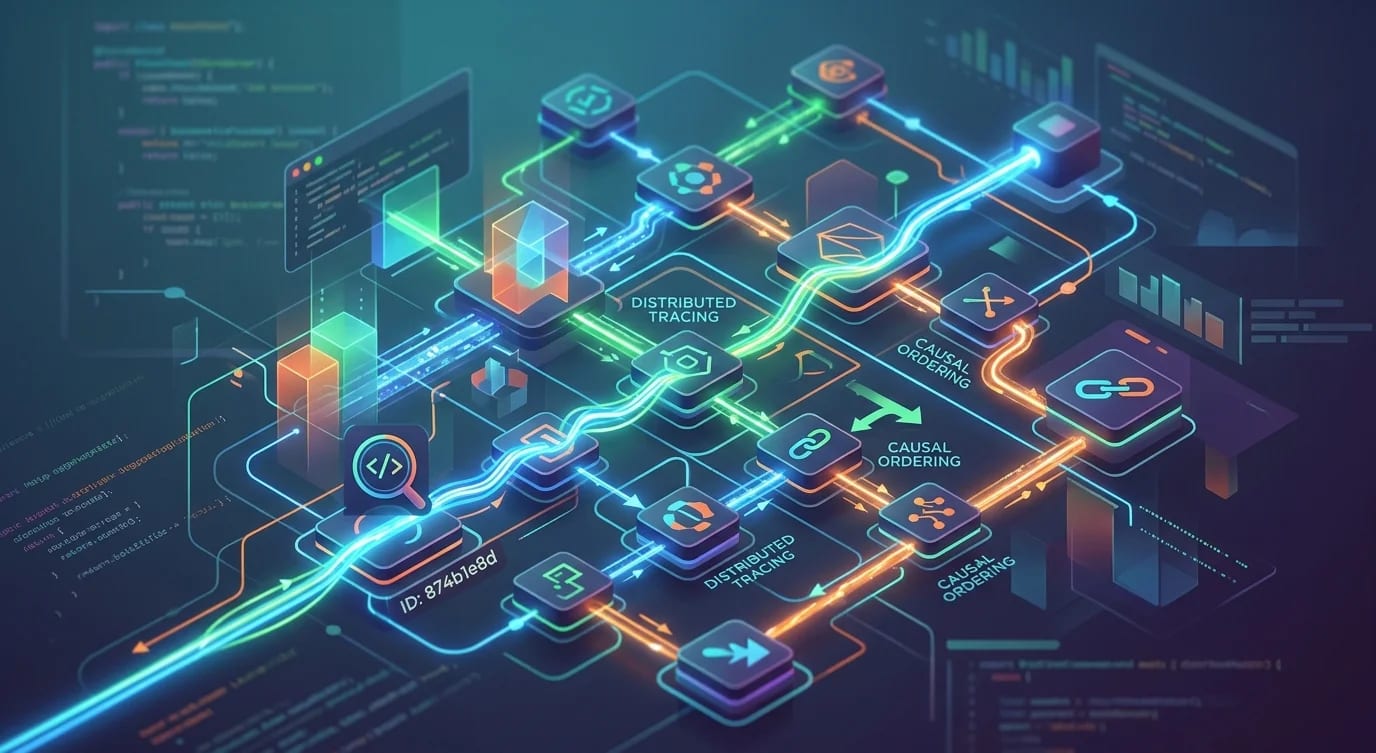
Debugging a monolith is hard. Debugging a distributed system is exponentially harder because the failure might originate in service A, manifest in service B, and only become visible in service C. Without a way to trace causation across service boundaries, you're reduced to grepping timestamps and hoping the clocks are synchronized.
Correlation IDs, distributed tracing, and structured log aggregation transform this guesswork into systematic investigation. They give you the ability to follow a single request through dozens of services and pinpoint exactly where things went wrong.
Correlation ID Propagation
Every request entering your system gets a unique correlation ID. This ID propagates through every service call, every message queue publish, and every log entry, creating a thread you can pull to unravel the entire request lifecycle.
// ❌ Logs without correlation — impossible to connect
// [auth-service] User login successful
// [order-service] Order created for user 42
// [payment-service] Payment failed
// Which login led to which order? Which order's payment failed?// ✅ Correlation ID middleware that propagates across services
import { randomUUID } from "crypto";
import { Request, Response, NextFunction } from "express";
const CORRELATION_HEADER = "x-correlation-id";
const CAUSATION_HEADER = "x-causation-id";
interface RequestContext {
correlationId: string;
causationId: string;
parentSpanId?: string;
serviceName: string;
}
function correlationMiddleware(
serviceName: string
) {
return (
req: Request,
res: Response,
next: NextFunction
) => {
// Inherit correlation ID from upstream or create new one
const correlationId =
req.headers[CORRELATION_HEADER] as string ??
randomUUID();
// Causation ID tracks the immediate parent
const causationId =
req.headers[CAUSATION_HEADER] as string ??
correlationId;
const context: RequestContext = {
correlationId,
causationId,
parentSpanId: req.headers["x-parent-span"] as string,
serviceName,
};
// Attach to request for downstream use
(req as any).context = context;
// Include in response headers for debugging
res.setHeader(CORRELATION_HEADER, correlationId);
next();
};
}
// HTTP client that propagates context
class CorrelatedHttpClient {
constructor(private context: RequestContext) {}
async get(url: string): Promise<Response> {
const spanId = randomUUID();
return fetch(url, {
headers: {
[CORRELATION_HEADER]: this.context.correlationId,
[CAUSATION_HEADER]: spanId,
"x-parent-span": this.context.parentSpanId ?? "",
},
});
}
async post(
url: string,
body: unknown
): Promise<Response> {
const spanId = randomUUID();
return fetch(url, {
method: "POST",
headers: {
"Content-Type": "application/json",
[CORRELATION_HEADER]: this.context.correlationId,
[CAUSATION_HEADER]: spanId,
"x-parent-span": this.context.parentSpanId ?? "",
},
body: JSON.stringify(body),
});
}
}The distinction between correlation and causation IDs matters. The correlation ID stays the same across the entire request chain. The causation ID changes at each hop, creating a chain: request A caused call B, which caused call C. This lets you reconstruct the exact call graph.
Structured Logging for Aggregation
Unstructured logs are noise at scale. Structured logs with consistent fields enable querying across millions of entries from dozens of services.
interface StructuredLog {
  timestamp: string;
  level: "debug" | "info" | "warn" | "error";
  service: string;
  correlationId: string;
  causationId: string;
  spanId: string;
  message: string;
  duration?: number;
  error?: {
    name: string;
    message: string;
    stack?: string;
  };
  metadata: Record<string, unknown>;
}

class CorrelatedLogger {
  constructor(
    private serviceName: string,
    private context: RequestContext
  ) {}

  info(message: string, metadata: Record<string, unknown> = {}): void {
    this.emit("info", message, metadata);
  }

  error(
    message: string,
    error: Error,
    metadata: Record<string, unknown> = {}
  ): void {
    this.emit("error", message, {
      ...metadata,
      error: {
        name: error.name,
        message: error.message,
        stack: error.stack,
      },
    });
  }

  private emit(
    level: StructuredLog["level"],
    message: string,
    metadata: Record<string, unknown>
  ): void {
    const log: StructuredLog = {
      timestamp: new Date().toISOString(),
      level,
      service: this.serviceName,
      correlationId: this.context.correlationId,
      causationId: this.context.causationId,
      spanId: this.context.parentSpanId ?? "",
      message,
      metadata,
    };

    // Single-line JSON for log aggregation systems
    console.log(JSON.stringify(log));
  }
}

// Usage in a request handler
function handleOrder(req: Request, res: Response) {
  const logger = new CorrelatedLogger(
    "order-service",
    (req as any).context
  );

  logger.info("Processing order", {
    orderId: req.body.orderId,
    itemCount: req.body.items.length,
  });

  // Later, if something fails:
  // logger.error("Payment processing failed", paymentError, {
  //   orderId: req.body.orderId,
  //   paymentProvider: "stripe",
  // });
}
With this structure, you can query your log aggregation system with correlationId = "abc-123" and see every log entry from every service for that specific request, ordered by timestamp.
Distributed Trace Assembly
Individual spans from each service must be assembled into a complete trace that shows the full request timeline.
interface Span {
  traceId: string;
  spanId: string;
  parentSpanId: string | null;
  serviceName: string;
  operationName: string;
  startTime: number;
  duration: number;
  status: "ok" | "error";
  tags: Record<string, string>;
  logs: SpanLog[];
}

interface SpanLog {
  timestamp: number;
  message: string;
  fields: Record<string, unknown>;
}

class TraceAssembler {
  private spans: Map<string, Span[]> = new Map();

  addSpan(span: Span): void {
    const existing = this.spans.get(span.traceId) ?? [];
    existing.push(span);
    this.spans.set(span.traceId, existing);
  }

  assembleTrace(traceId: string): {
    rootSpan: Span | null;
    tree: SpanNode[];
    totalDuration: number;
    criticalPath: Span[];
    errors: Span[];
  } | null {
    const spans = this.spans.get(traceId);
    if (!spans || spans.length === 0) return null;

    const rootSpan =
      spans.find((s) => s.parentSpanId === null) ?? null;

    const tree = this.buildTree(spans);
    const criticalPath = this.findCriticalPath(spans);
    const errors = spans.filter((s) => s.status === "error");

    const totalDuration = rootSpan?.duration ?? Math.max(
      ...spans.map((s) => s.startTime + s.duration)
    ) - Math.min(...spans.map((s) => s.startTime));

    return { rootSpan, tree, totalDuration, criticalPath, errors };
  }

  private buildTree(spans: Span[]): SpanNode[] {
    const nodeMap = new Map<string, SpanNode>();
    const roots: SpanNode[] = [];

    for (const span of spans) {
      nodeMap.set(span.spanId, { span, children: [] });
    }

    for (const span of spans) {
      const node = nodeMap.get(span.spanId)!;
      if (span.parentSpanId) {
        const parent = nodeMap.get(span.parentSpanId);
        if (parent) {
          parent.children.push(node);
        } else {
          roots.push(node);
        }
      } else {
        roots.push(node);
      }
    }

    return roots;
  }

  private findCriticalPath(spans: Span[]): Span[] {
    // The critical path is the longest chain of sequential spans
    return spans
      .filter((s) => s.status === "error" || s.duration > 500)
      .sort((a, b) => b.duration - a.duration);
  }
}

interface SpanNode {
  span: Span;
  children: SpanNode[];
}
Clock Skew and Causal Ordering
Distributed systems can't rely on wall-clock timestamps for ordering because clocks drift. Lamport timestamps or vector clocks establish causal ordering without synchronized clocks.
class LamportClock {
  private counter: number = 0;

  tick(): number {
    return ++this.counter;
  }

  receive(remoteTimestamp: number): number {
    this.counter = Math.max(this.counter, remoteTimestamp) + 1;
    return this.counter;
  }

  current(): number {
    return this.counter;
  }
}

// Use in service-to-service communication
class CausalMessageClient {
  private clock: LamportClock;

  constructor(private serviceName: string) {
    this.clock = new LamportClock();
  }

  send(
    destination: string,
    payload: unknown
  ): { payload: unknown; timestamp: number; sender: string } {
    const timestamp = this.clock.tick();

    return {
      payload,
      timestamp,
      sender: this.serviceName,
    };
  }

  receive(message: {
    payload: unknown;
    timestamp: number;
    sender: string;
  }): { payload: unknown; localTimestamp: number } {
    const localTimestamp = this.clock.receive(
      message.timestamp
    );

    return {
      payload: message.payload,
      localTimestamp,
    };
  }
}
If event A has Lamport timestamp 5 and event B has timestamp 8, you know B didn't cause A. This partial ordering is enough to establish "happens-before" relationships that wall-clock time cannot guarantee.
Key Takeaways
Distributed debugging requires intentional instrumentation—without correlation IDs and structured logging, tracing a request across services is nearly impossible. Propagate both correlation IDs (constant across the full request) and causation IDs (change at each hop) to reconstruct the exact call graph that led to a failure. Use structured JSON logging with consistent fields across all services so log aggregation queries can span the entire system. Assemble distributed traces from individual spans to visualize the complete request timeline, identify the critical path, and spot where latency accumulates. Don't trust wall-clock timestamps for event ordering in distributed systems—use Lamport clocks or vector clocks to establish causal relationships that survive clock skew. The investment in observability infrastructure pays for itself the first time you diagnose a cross-service failure in minutes instead of hours, tracing the exact chain of events from trigger to symptom.


