Monitoring and Alerting Strategies That Actually Work
Alert fatigue kills incident response — build a monitoring strategy around SLIs, meaningful thresholds, and actionable alerts instead of noisy dashboards.
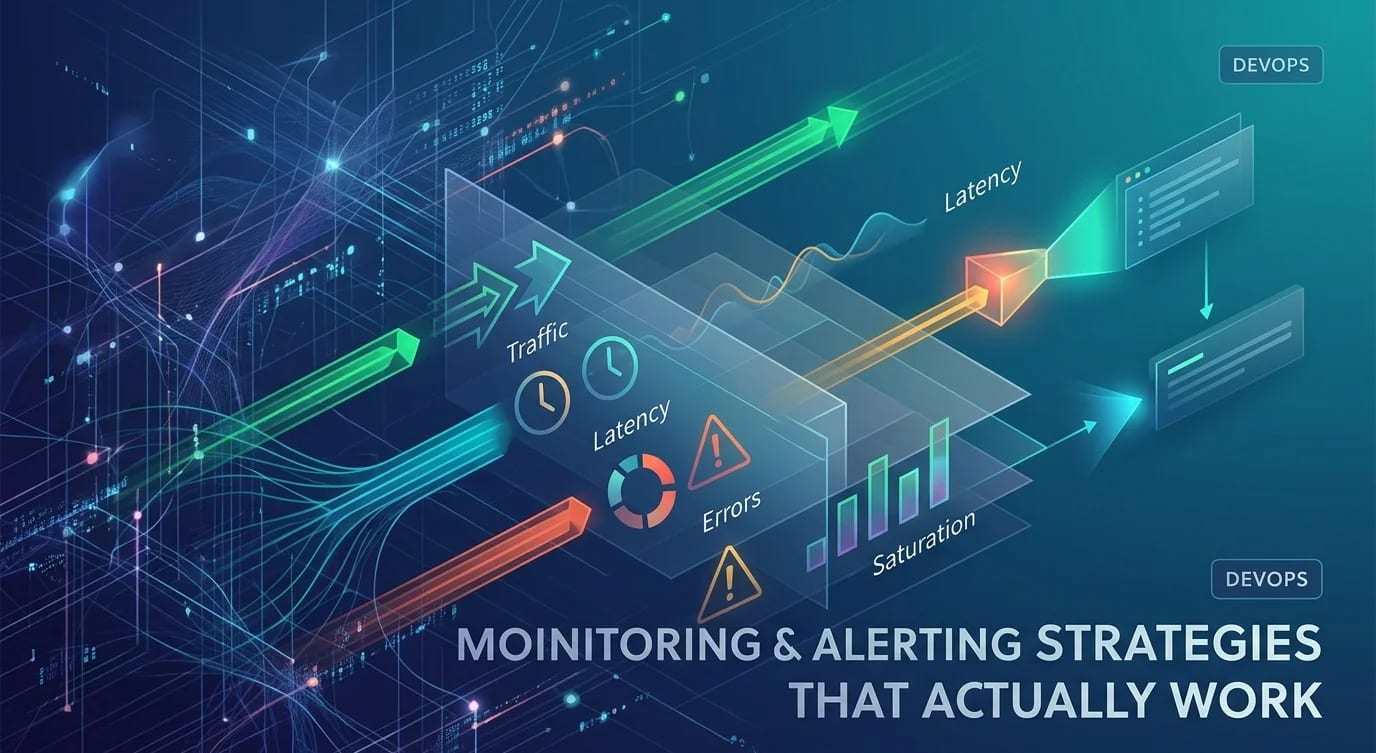
Most monitoring setups fail not because they lack data but because they generate too much noise. Teams drown in alerts that don't require action, eventually ignoring their pagers entirely. Effective monitoring starts with defining what matters, setting thresholds that reflect real user impact, and ensuring every alert has a clear response path.
The Four Golden Signals
Google's SRE book identifies four signals that cover most monitoring needs. Every service should track these before adding anything else.
// Express middleware that captures the four golden signals
import { Counter, Histogram, Gauge } from "prom-client";

// 1. Latency — how long requests take
const httpDuration = new Histogram({
  name: "http_request_duration_seconds",
  help: "Duration of HTTP requests in seconds",
  labelNames: ["method", "route", "status_code"],
  buckets: [0.01, 0.05, 0.1, 0.25, 0.5, 1, 2.5, 5],
});

// 2. Traffic — how many requests per second
const httpRequests = new Counter({
  name: "http_requests_total",
  help: "Total number of HTTP requests",
  labelNames: ["method", "route", "status_code"],
});

// 3. Errors — rate of failed requests
const httpErrors = new Counter({
  name: "http_errors_total",
  help: "Total number of HTTP errors",
  labelNames: ["method", "route", "error_type"],
});

// 4. Saturation — how full your resources are
const activeConnections = new Gauge({
  name: "http_active_connections",
  help: "Number of active HTTP connections",
});

app.use((req, res, next) => {
  activeConnections.inc();
  const end = httpDuration.startTimer({
    method: req.method,
    route: req.route?.path ?? req.path,
  });

  res.on("finish", () => {
    const labels = {
      method: req.method,
      route: req.route?.path ?? req.path,
      status_code: res.statusCode.toString(),
    };
    end(labels);
    httpRequests.inc(labels);
    activeConnections.dec();

    if (res.statusCode >= 500) {
      httpErrors.inc({ ...labels, error_type: "server_error" });
    }
  });

  next();
});
Service Level Indicators (SLIs)
SLIs translate raw metrics into user-facing quality measurements. They answer "is the user experience acceptable?"
# Prometheus alerting rules based on SLIs
groups:
  - name: sli-alerts
    rules:
      # Availability SLI: proportion of successful requests
      - alert: HighErrorRate
        expr: |
          (
            sum(rate(http_errors_total[5m]))
            /
            sum(rate(http_requests_total[5m]))
          ) > 0.01
        for: 5m
        labels:
          severity: critical
        annotations:
          summary: "Error rate exceeds 1% for 5 minutes"
          runbook: "https://wiki.internal/runbooks/high-error-rate"

      # Latency SLI: proportion of requests served within threshold
      - alert: HighLatency
        expr: |
          (
            sum(rate(http_request_duration_seconds_bucket{le="0.5"}[5m]))
            /
            sum(rate(http_request_duration_seconds_count[5m]))
          ) < 0.95
        for: 5m
        labels:
          severity: warning
        annotations:
          summary: "Less than 95% of requests served within 500ms"
Alert Design Principles
An alert should wake someone up only if it requires immediate human action. Everything else belongs on a dashboard.
# ❌ Noisy alert — fires on any single error
- alert: AnyServerError
  expr: http_errors_total > 0
  labels:
    severity: critical

# ✅ Meaningful alert — fires on sustained elevated error rate
- alert: ElevatedErrorRate
  expr: |
    (
      sum(rate(http_errors_total[10m]))
      /
      sum(rate(http_requests_total[10m]))
    ) > 0.005
  for: 10m  # Must sustain for 10 minutes
  labels:
    severity: warning
  annotations:
    summary: "Error rate above 0.5% for 10 minutes"
    impact: "Approximately {{ $value | humanizePercentage }} of users affected"
    runbook: "https://wiki.internal/runbooks/elevated-errors"
    dashboard: "https://grafana.internal/d/api-overview"
Every alert annotation should include: what's happening, who's affected, a runbook link, and a dashboard link. If the on-call engineer has to search for context, the alert is incomplete.
Structured Logging for Correlation
Metrics tell you something is wrong. Logs tell you why. Structured logs with correlation IDs let you trace a specific failing request through multiple services.
// ❌ Unstructured logs — impossible to search or correlate
console.log("Error processing order for user " + userId);

// ✅ Structured JSON logs with correlation ID
import { randomUUID } from "crypto";

app.use((req, res, next) => {
  req.correlationId = req.headers["x-correlation-id"] as string ?? randomUUID();
  res.setHeader("x-correlation-id", req.correlationId);
  next();
});

function log(level: string, message: string, context: Record<string, unknown>) {
  console.log(JSON.stringify({
    timestamp: new Date().toISOString(),
    level,
    message,
    correlationId: context.correlationId,
    service: "order-service",
    ...context,
  }));
}

// Usage in route handler
app.post("/orders", async (req, res) => {
  log("info", "Processing order", {
    correlationId: req.correlationId,
    userId: req.body.userId,
    itemCount: req.body.items.length,
  });

  try {
    const order = await createOrder(req.body);
    log("info", "Order created", {
      correlationId: req.correlationId,
      orderId: order.id,
    });
    res.json(order);
  } catch (error) {
    log("error", "Order creation failed", {
      correlationId: req.correlationId,
      error: error instanceof Error ? error.message : String(error),
    });
    res.status(500).json({ error: "Order processing failed" });
  }
});
Dashboard Hierarchy
Organize dashboards in layers: a top-level overview for quick triage, service-level dashboards for investigation, and component-level dashboards for deep debugging.
Dashboard Hierarchy:
├── System Overview (RED metrics for all services)
│   ├── API Gateway (request rate, error rate, latency p50/p95/p99)
│   ├── Services (per-service health summary)
│   └── Infrastructure (CPU, memory, disk across clusters)
├── Service: Order API (detailed metrics)
│   ├── Endpoint breakdown (latency per route)
│   ├── Database queries (slow queries, pool utilization)
│   └── Downstream dependencies (timeout rates)
└── Component: PostgreSQL (deep dive)
    ├── Connection pool utilization
    ├── Query performance (p95, p99)
    ├── Replication lag
    └── Disk I/O and buffer cache hit ratio
Key Takeaways
- Start with the four golden signals — latency, traffic, errors, and saturation cover most needs
- Define SLIs that reflect user experience — alert on sustained degradation, not individual failures
- Every alert needs a runbook — if the responder has to investigate what the alert means, it's incomplete
- Structured logs with correlation IDs — enable tracing a single request across services
- Layer your dashboards — overview for triage, service-level for investigation, component-level for debugging
- Alert on symptoms, not causes — users care about error rates and latency, not CPU utilization


