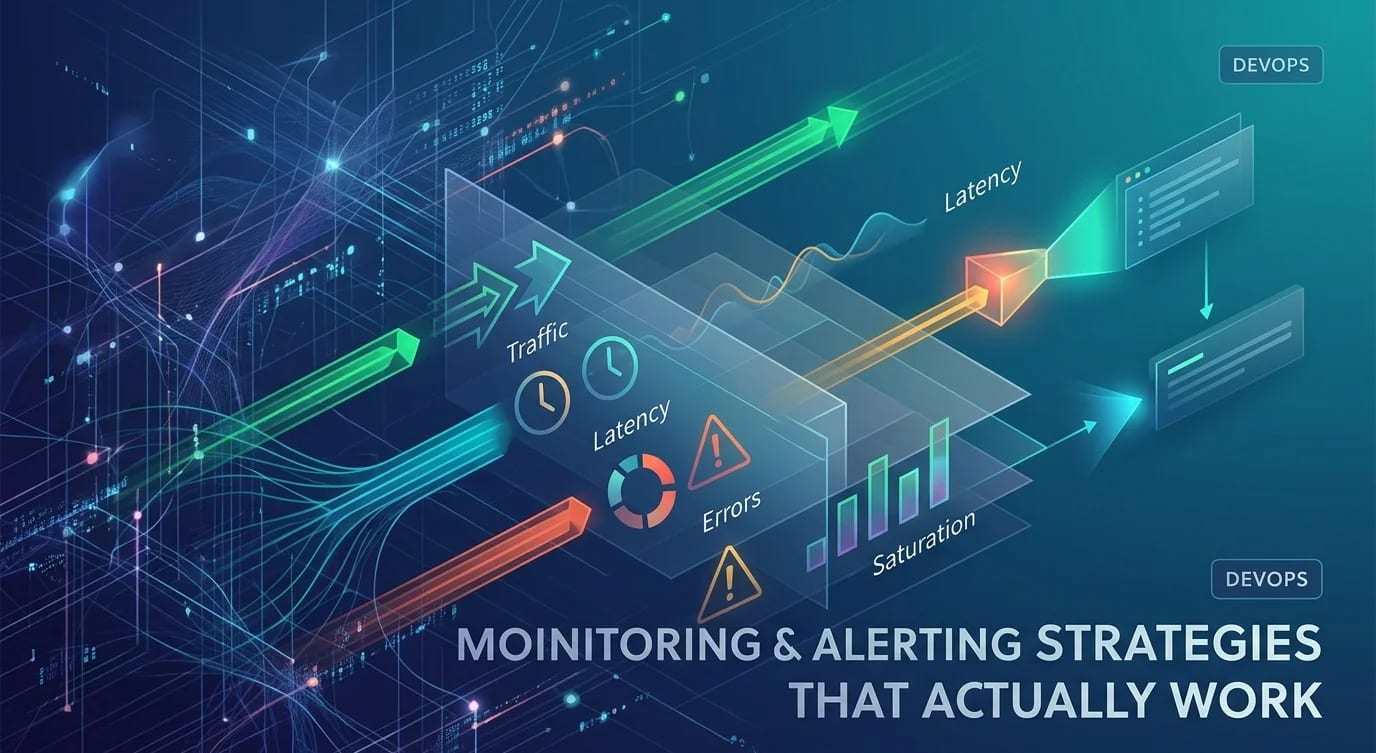
Monitoring and Alerting Strategies That Reduce Alert Fatigue
Design monitoring and alerting that surfaces real problems: SLO-based alerts, symptom detection, routing hierarchies, runbook automation and noise reduction.

Alert Fatigue Kills Reliability
When every alert fires, no alert matters. Teams drown in notifications, start ignoring pages, and miss the one alert that signals a real outage. The fix is not more alerts—it is fewer, better-targeted alerts tied to what users actually experience.
Symptom-Based vs. Cause-Based Alerts
Most monitoring starts with cause-based alerts: CPU above 80%, disk above 90%, memory above 85%. These fire constantly and rarely correspond to user-facing problems. Symptom-based alerts detect what users experience: elevated error rates, slow response times, failed transactions.
// ❌ Cause-based alert — fires constantly, rarely actionable
const cpuAlert = {
  name: "High CPU Usage",
  condition: "cpu_usage > 80%",
  // Fires 50 times a week, ignored by day 3
};

// ✅ Symptom-based alert — fires when users are affected
interface SLOAlert {
  name: string;
  sli: string; // Service Level Indicator
  objective: number; // e.g., 99.9%
  window: string; // Measurement window
  burnRate: number; // How fast we're consuming error budget
  severity: "warning" | "critical";
}

const checkoutAvailability: SLOAlert = {
  name: "Checkout success rate below SLO",
  sli: "successful_checkouts / total_checkout_attempts",
  objective: 99.9,
  window: "30d",
  burnRate: 14.4, // Exhausts 30d budget in 2 hours
  severity: "critical",
};

const apiLatency: SLOAlert = {
  name: "API p99 latency exceeds SLO",
  sli: "requests_under_500ms / total_requests",
  objective: 99.0,
  window: "30d",
  burnRate: 6, // Exhausts 30d budget in 5 hours
  severity: "warning",
};
Multi-Window Burn Rate Alerts
A single-window burn rate alert either catches slow degradations (long window) or fast failures (short window), but not both. Use multi-window alerts to detect both patterns while suppressing noise.
interface MultiWindowBurnRate {
  longWindow: { duration: string; burnRate: number };
  shortWindow: { duration: string; burnRate: number };
  severity: "page" | "ticket";
}

// Both windows must fire simultaneously to trigger the alert
const alertPolicies: MultiWindowBurnRate[] = [
  {
    // Fast burn: detect outages within minutes
    longWindow: { duration: "1h", burnRate: 14.4 },
    shortWindow: { duration: "5m", burnRate: 14.4 },
    severity: "page", // Wake someone up
  },
  {
    // Slow burn: detect gradual degradation
    longWindow: { duration: "6h", burnRate: 6 },
    shortWindow: { duration: "30m", burnRate: 6 },
    severity: "page",
  },
  {
    // Very slow burn: create a ticket, don't page
    longWindow: { duration: "3d", burnRate: 1 },
    shortWindow: { duration: "6h", burnRate: 1 },
    severity: "ticket",
  },
];

function evaluateBurnRate(
  errorCount: number,
  totalCount: number,
  sloTarget: number,
  windowHours: number,
  budgetWindowDays: number
): number {
  const errorRate = totalCount === 0 ? 0 : errorCount / totalCount;
  const errorBudget = 1 - sloTarget / 100;
  const windowFraction = windowHours / (budgetWindowDays * 24);

  return errorRate / (errorBudget * windowFraction);
}
Alert Routing and Escalation
Not every alert should page the on-call engineer. Route alerts based on severity, time of day, and ownership.
interface AlertRoute {
  match: {
    severity: string[];
    services?: string[];
    labels?: Record<string, string>;
  };
  receivers: AlertReceiver[];
  muteWindows?: MuteWindow[];
  repeatInterval: string;
}

interface AlertReceiver {
  type: "pagerduty" | "slack" | "email" | "ticket";
  target: string;
}

interface MuteWindow {
  weekdays?: number[];
  startTime?: string;
  endTime?: string;
}

const routingConfig: AlertRoute[] = [
  {
    // Critical: always page
    match: { severity: ["critical"] },
    receivers: [
      { type: "pagerduty", target: "primary-oncall" },
      { type: "slack", target: "#incidents" },
    ],
    repeatInterval: "5m",
  },
  {
    // Warning: Slack during business hours, suppress overnight
    match: { severity: ["warning"] },
    receivers: [
      { type: "slack", target: "#alerts-warning" },
    ],
    muteWindows: [
      {
        weekdays: [1, 2, 3, 4, 5],
        startTime: "22:00",
        endTime: "08:00",
      },
      { weekdays: [6, 7] }, // Mute all weekend
    ],
    repeatInterval: "30m",
  },
  {
    // Info: create ticket, never page
    match: { severity: ["info"] },
    receivers: [
      { type: "ticket", target: "ops-backlog" },
    ],
    repeatInterval: "24h",
  },
];
Runbook Links and Alert Context
An alert without context requires the responder to investigate from scratch. Include runbook links, recent changes, and relevant dashboards directly in the alert.
// ❌ Alert with no context — responder starts from zero
// "ALERT: checkout_error_rate > 1%"

// ✅ Alert with full context for fast response
interface EnrichedAlert {
  title: string;
  description: string;
  severity: "critical" | "warning" | "info";
  runbookUrl: string;
  dashboardUrl: string;
  recentDeployments: Deployment[];
  impactEstimate: string;
  suggestedActions: string[];
}

function enrichAlert(
  rawAlert: RawAlert,
  deployments: Deployment[]
): EnrichedAlert {
  const recentDeploys = deployments.filter(
    (d) => Date.now() - d.timestamp < 60 * 60 * 1000
  );

  return {
    title: rawAlert.title,
    description: rawAlert.description,
    severity: rawAlert.severity,
    runbookUrl: `https://wiki.internal/runbooks/${rawAlert.alertName}`,
    dashboardUrl: `https://grafana.internal/d/${rawAlert.service}`,
    recentDeployments: recentDeploys,
    impactEstimate: estimateImpact(rawAlert),
    suggestedActions: [
      recentDeploys.length > 0
        ? `Recent deploy detected — consider rollback: ${recentDeploys[0].sha}`
        : "No recent deployments — investigate infrastructure",
      `Check dependency health: ${rawAlert.service}-dependencies`,
    ],
  };
}

function estimateImpact(alert: RawAlert): string {
  if (alert.affectedUsersPercent > 50) return "Major — >50% users affected";
  if (alert.affectedUsersPercent > 10) return "Moderate — 10-50% users affected";
  return "Minor — <10% users affected";
}
Alert Deduplication and Grouping
When a database goes down, every service that depends on it fires alerts. Without grouping, the on-call engineer gets twenty pages for one root cause.
interface AlertGroup {
  groupKey: string;
  alerts: Alert[];
  firstFired: number;
  lastFired: number;
}

class AlertGrouper {
  private groups = new Map<string, AlertGroup>();
  private readonly GROUP_WINDOW = 5 * 60 * 1000; // 5 minutes

  addAlert(alert: Alert): AlertGroup {
    const groupKey = this.computeGroupKey(alert);
    const existing = this.groups.get(groupKey);

    if (existing && Date.now() - existing.lastFired < this.GROUP_WINDOW) {
      existing.alerts.push(alert);
      existing.lastFired = Date.now();
      return existing;
    }

    const group: AlertGroup = {
      groupKey,
      alerts: [alert],
      firstFired: Date.now(),
      lastFired: Date.now(),
    };
    this.groups.set(groupKey, group);
    return group;
  }

  private computeGroupKey(alert: Alert): string {
    // Group by service and alert type — not by instance
    return `${alert.service}:${alert.alertName}`;
  }

  getSummary(group: AlertGroup): string {
    return `[${group.alerts.length} alerts] ${group.groupKey} — ` +
      `first fired ${new Date(group.firstFired).toISOString()}`;
  }
}
Key Takeaways
Alert fatigue is an architecture problem, not a discipline problem. Replace cause-based alerts (CPU, memory, disk) with symptom-based alerts tied to SLOs that reflect user experience. Use multi-window burn rate alerts to catch both fast outages and slow degradation without false positives.
Route alerts by severity: page for critical, Slack for warnings during business hours, tickets for informational. Every alert must include a runbook link, relevant dashboard, recent deployments, and suggested first actions—an alert without context is just noise. Group related alerts by service and root cause so a single database failure produces one notification, not twenty. The goal is not zero alerts. The goal is that every alert that fires is worth investigating, and the responder knows exactly where to start.