
Engineering
Observability-Driven Development
Shift observability left by designing around structured logs, distributed traces and meaningful metrics from day one — faster debugging, shorter incidents.
·4 min read
Tags
6 articles
Shift observability left by designing around structured logs, distributed traces and meaningful metrics from day one — faster debugging, shorter incidents.
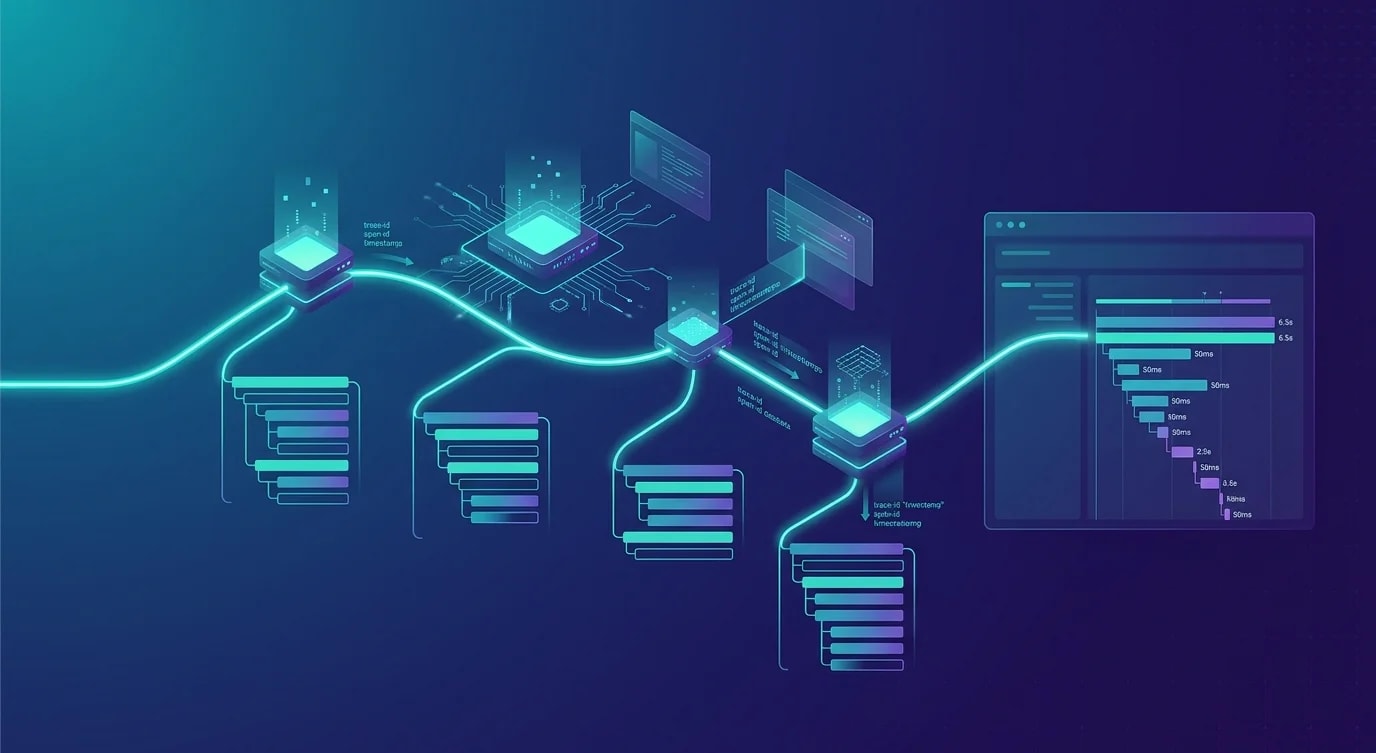
Implement distributed tracing across microservices with OpenTelemetry: context propagation, spans, sampling and the analysis that makes systems debuggable.

Set up a full observability stack with Prometheus metrics, structured JSON logging and OpenTelemetry tracing, and see how each signal connects to the others.

Build production distributed tracing with OpenTelemetry: context propagation, sampling strategies, storage backends, log correlation and cardinality.

A hands-on guide to instrumenting Node.js with OpenTelemetry: traces, metrics and logs via auto-instrumentation, custom spans, context and exporters.
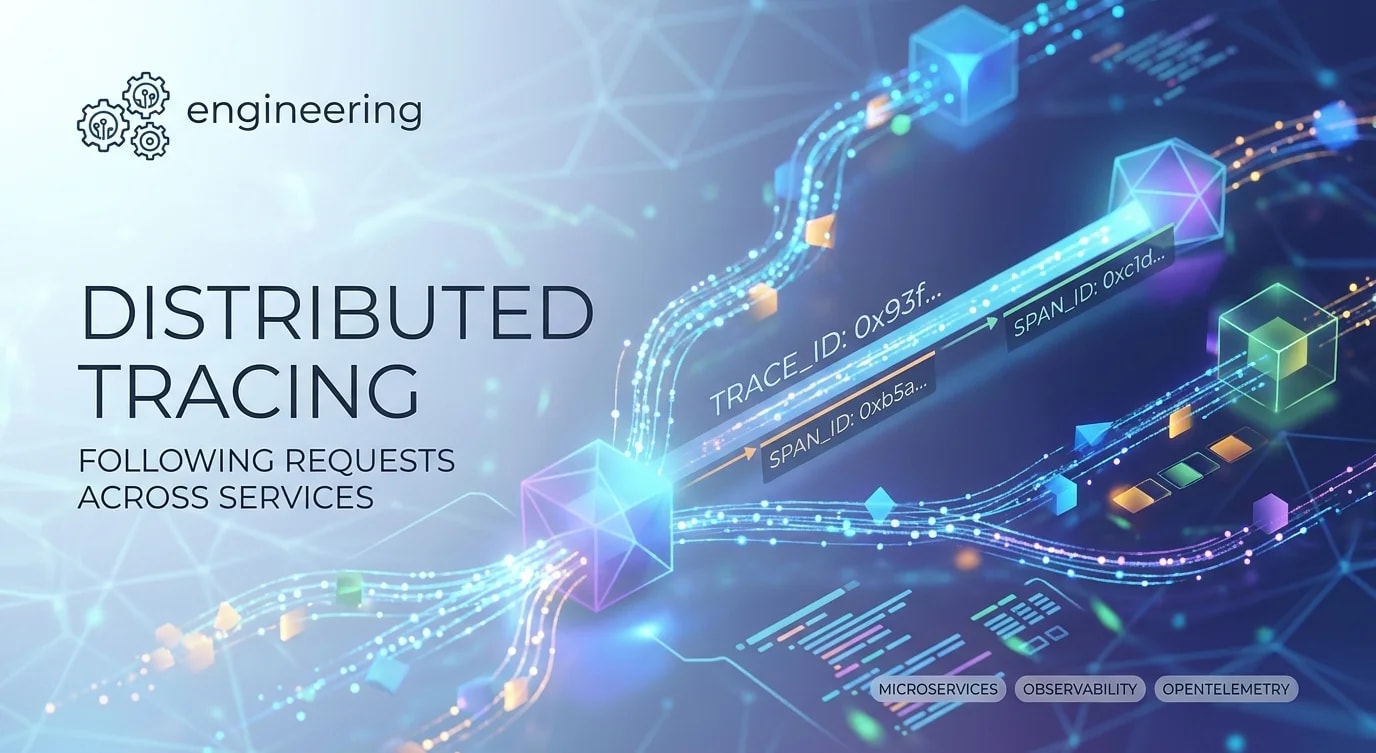
When a request touches five services, each log is useless alone — distributed tracing ties them together with trace IDs, spans and context propagation.