Gestión de incidentes: de la detección al post-mortem
Enfoque sistemático de la gestión de incidentes: diseño de alertas, severidad, flujos de guardia, protocolos de comunicación y post-mortems sin culpas.
Los incidentes son inevitables—el caos es opcional
Todo sistema en producción tendrá incidentes. La diferencia entre los equipos que los gestionan bien y los que no, no está en el talento de ingeniería, sino en el proceso. Un marco de gestión de incidentes claro reduce el tiempo medio de recuperación, evita el pánico organizacional en cadena y convierte cada fallo en una oportunidad de aprendizaje.
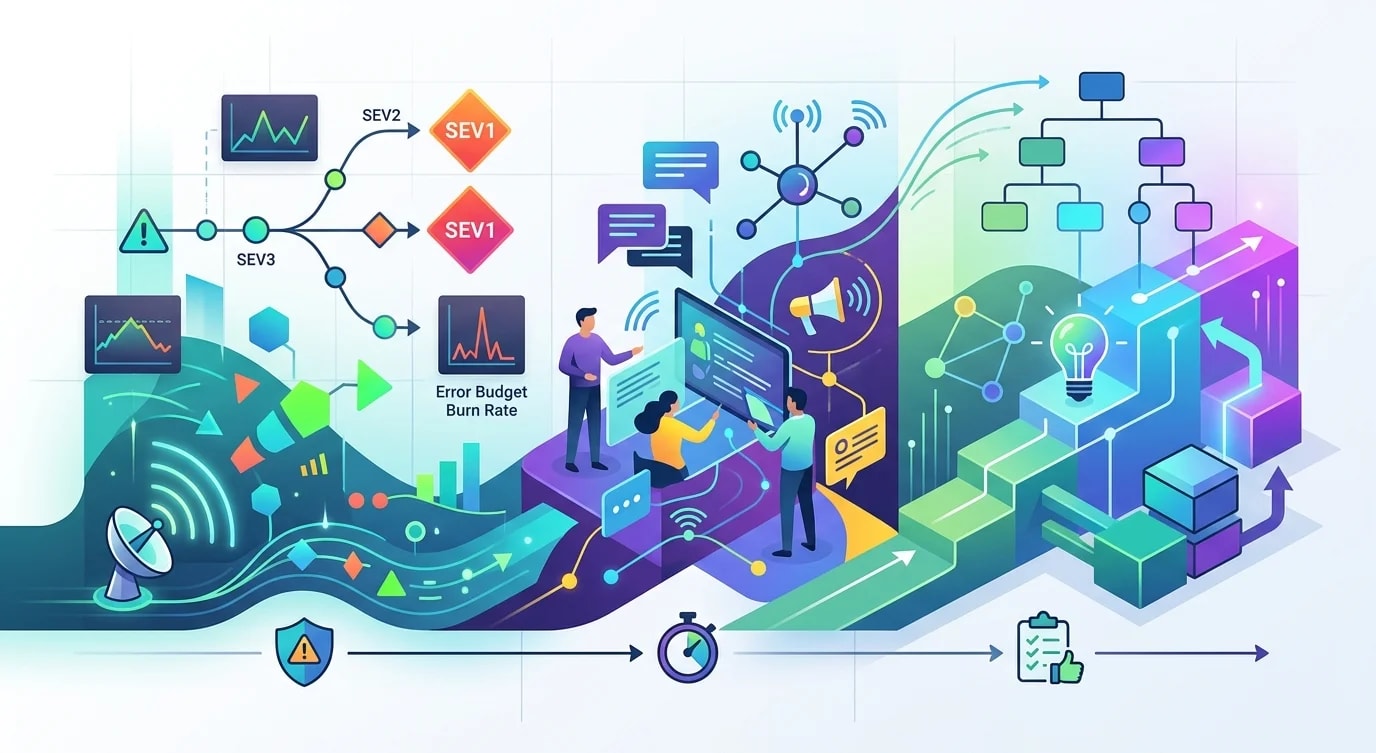
Esta guía cubre el ciclo de vida completo de un incidente: detección, clasificación, respuesta, comunicación, resolución y el post-mortem que evita que se repita.
Diseño de alertas que reduce el ruido
El primer paso en la gestión de incidentes es la detección. Las alertas mal diseñadas generan fatiga de alertas, lo que hace que el equipo termine ignorando problemas reales.
// ❌ Noisy alerting — triggers on transient spikes
interface BadAlert {
  name: string;
  condition: string;
  problem: string;
}

const noisyAlerts: BadAlert[] = [
  {
    name: "CPU > 80%",
    condition: "Any single data point above threshold",
    problem: "Triggers on 2-second spikes during deployments",
  },
  {
    name: "Any 5xx error",
    condition: "Single error occurrence",
    problem: "Triggers on retry-handled transient failures",
  },
];

// ✅ Meaningful alerting — symptom-based with burn rate
interface AlertRule {
  name: string;
  severity: "critical" | "warning" | "info";
  condition: {
    metric: string;
    operator: "gt" | "lt";
    threshold: number;
    window: string;
    evaluationPeriods: number;
  };
  notification: {
    channel: string;
    escalationAfter?: string;
  };
}

const meaningfulAlerts: AlertRule[] = [
  {
    name: "Error budget burn rate — critical",
    severity: "critical",
    condition: {
      metric: "sli:availability:error_budget_burn_rate",
      operator: "gt",
      threshold: 14.4,
      window: "5m",
      evaluationPeriods: 1,
    },
    notification: {
      channel: "pagerduty-critical",
      escalationAfter: "5m",
    },
  },
  {
    name: "Error budget burn rate — warning",
    severity: "warning",
    condition: {
      metric: "sli:availability:error_budget_burn_rate",
      operator: "gt",
      threshold: 1.0,
      window: "1h",
      evaluationPeriods: 3,
    },
    notification: {
      channel: "slack-oncall",
    },
  },
  {
    name: "P99 latency SLO breach",
    severity: "critical",
    condition: {
      metric: "http_request_duration_p99",
      operator: "gt",
      threshold: 2000,
      window: "10m",
      evaluationPeriods: 2,
    },
    notification: {
      channel: "pagerduty-critical",
      escalationAfter: "10m",
    },
  },
];
Las alertas deben basarse en síntomas (el impacto visible para el usuario), no en causas (el uso de CPU). Una alerta de tasa de consumo (burn rate) indica que el presupuesto de errores se está agotando más rápido de lo sostenible, lo cual se traduce directamente en una degradación de la experiencia del usuario.
Marco de clasificación de severidad
La severidad determina la urgencia de la respuesta y los requisitos de comunicación. Un marco claro evita tanto la subreacción como la sobrerreacción.
interface SeverityLevel {
  level: "SEV1" | "SEV2" | "SEV3" | "SEV4";
  description: string;
  criteria: string[];
  responseTime: string;
  communicationCadence: string;
  exampleScenarios: string[];
}

const severityFramework: SeverityLevel[] = [
  {
    level: "SEV1",
    description: "Critical — Complete service outage or data loss",
    criteria: [
      "Core functionality unavailable for all users",
      "Data corruption or loss occurring",
      "Security breach with active exploitation",
    ],
    responseTime: "Acknowledge within 5 minutes",
    communicationCadence: "Status update every 15 minutes",
    exampleScenarios: [
      "Payment processing completely down",
      "Database primary node unrecoverable",
      "Authentication service returning 500 for all requests",
    ],
  },
  {
    level: "SEV2",
    description: "Major — Significant degradation or partial outage",
    criteria: [
      "Core functionality degraded for subset of users",
      "Non-core functionality completely unavailable",
      "Performance degradation exceeding 3x normal latency",
    ],
    responseTime: "Acknowledge within 15 minutes",
    communicationCadence: "Status update every 30 minutes",
    exampleScenarios: [
      "Search returning stale results",
      "Image uploads failing for EU region",
      "API latency at 5s instead of normal 200ms",
    ],
  },
  {
    level: "SEV3",
    description: "Minor — Limited impact, workaround available",
    criteria: [
      "Non-critical feature degraded",
      "Issue affects small percentage of users",
      "Manual workaround available",
    ],
    responseTime: "Acknowledge within 1 hour",
    communicationCadence: "Status update every 2 hours",
    exampleScenarios: [
      "Email notifications delayed by 10 minutes",
      "Dashboard chart rendering incorrectly on mobile",
    ],
  },
  {
    level: "SEV4",
    description: "Informational — Cosmetic or minor issues",
    criteria: [
      "No user-facing impact",
      "Cosmetic issues",
      "Monitoring anomaly without impact",
    ],
    responseTime: "Next business day",
    communicationCadence: "Resolution summary only",
    exampleScenarios: [
      "Internal admin tool UI misalignment",
      "Log volume spike without errors",
    ],
  },
];
Flujo de trabajo de respuesta a incidentes
Una vez que se detecta y clasifica un incidente, la respuesta sigue un flujo de trabajo estructurado con roles claramente definidos.
interface IncidentRole {
  role: string;
  responsibilities: string[];
  requiredSkills: string[];
}

const incidentRoles: IncidentRole[] = [
  {
    role: "Incident Commander (IC)",
    responsibilities: [
      "Coordinate response efforts",
      "Make decisions about severity and escalation",
      "Ensure communication cadence is maintained",
      "Decide when incident is resolved",
    ],
    requiredSkills: [
      "Calm under pressure",
      "Cross-team communication",
      "Decision-making with incomplete information",
    ],
  },
  {
    role: "Technical Lead",
    responsibilities: [
      "Investigate root cause",
      "Propose and implement mitigations",
      "Coordinate with other engineers on debugging",
    ],
    requiredSkills: [
      "Deep system knowledge",
      "Debugging under pressure",
      "Ability to explain technical details clearly",
    ],
  },
  {
    role: "Communications Lead",
    responsibilities: [
      "Draft and publish status page updates",
      "Coordinate with customer support",
      "Handle executive and stakeholder communications",
    ],
    requiredSkills: [
      "Clear writing under pressure",
      "Stakeholder management",
      "Empathy for user impact",
    ],
  },
];

interface IncidentTimeline {
  incidentId: string;
  severity: string;
  events: Array<{
    timestamp: Date;
    actor: string;
    action: string;
    details: string;
  }>;
}

function logTimelineEvent(
  timeline: IncidentTimeline,
  actor: string,
  action: string,
  details: string
): void {
  timeline.events.push({
    timestamp: new Date(),
    actor,
    action,
    details,
  });
}
Plantillas de comunicación de estado
Una comunicación clara y constante durante los incidentes reduce la ansiedad de los usuarios, del equipo de soporte y de los líderes.
interface StatusUpdate {
  severity: string;
  status: "investigating" | "identified" | "monitoring" | "resolved";
  affectedServices: string[];
  userImpact: string;
  currentAction: string;
  nextUpdate: string;
}

function formatStatusUpdate(update: StatusUpdate): string {
  const timestamp = new Date().toISOString();

  return `
**Incident Update** — ${timestamp}
**Severity**: ${update.severity}
**Status**: ${update.status.toUpperCase()}
**Affected Services**: ${update.affectedServices.join(", ")}

**Impact**: ${update.userImpact}

**Current Action**: ${update.currentAction}

**Next Update**: ${update.nextUpdate}
  `.trim();
}

// Example usage
const update = formatStatusUpdate({
  severity: "SEV2",
  status: "identified",
  affectedServices: ["API Gateway", "User Authentication"],
  userImpact:
    "Approximately 15% of login attempts are failing with timeout errors. Users who are already authenticated are not affected.",
  currentAction:
    "We have identified elevated connection pool exhaustion on the auth database. We are scaling the connection pool and have enabled the authentication cache fallback.",
  nextUpdate: "In 30 minutes or sooner if status changes",
});
Estructura del post-mortem sin culpas
El post-mortem es la parte más valiosa de la gestión de incidentes. Convierte los fallos en mejoras concretas del sistema.
interface PostMortem {
  incidentId: string;
  title: string;
  date: string;
  severity: string;
  duration: string;
  authors: string[];
  timeline: Array<{ time: string; event: string }>;
  rootCause: string;
  contributing: string[];
  impact: {
    usersAffected: number;
    revenueImpact: string;
    sloImpact: string;
  };
  whatWentWell: string[];
  whatWentPoorly: string[];
  actionItems: Array<{
    id: string;
    description: string;
    owner: string;
    priority: "P0" | "P1" | "P2";
    dueDate: string;
    status: "open" | "in-progress" | "completed";
  }>;
}

const examplePostMortem: PostMortem = {
  incidentId: "INC-2025-042",
  title: "Authentication service timeout due to connection pool exhaustion",
  date: "2025-02-15",
  severity: "SEV2",
  duration: "47 minutes",
  authors: ["Alice Chen", "Bob Martinez"],
  timeline: [
    { time: "14:02", event: "Alert fired: auth service error rate > 5%" },
    { time: "14:07", event: "IC acknowledged, SEV2 declared" },
    { time: "14:12", event: "Root cause identified: connection pool at max" },
    { time: "14:18", event: "Mitigation: increased pool size, enabled cache" },
    { time: "14:35", event: "Error rate returned to normal" },
    { time: "14:49", event: "Incident resolved, monitoring confirmed stable" },
  ],
  rootCause:
    "A marketing campaign drove 3x normal login traffic. The auth database connection pool was sized for 2x peak and did not auto-scale.",
  contributing: [
    "No load testing had been run at 3x traffic levels",
    "Marketing campaign was not communicated to engineering",
    "Connection pool monitoring alert threshold was too high",
  ],
  impact: {
    usersAffected: 12500,
    revenueImpact: "Estimated $8,200 in lost conversions",
    sloImpact: "Monthly availability SLO consumed 3 days of error budget",
  },
  whatWentWell: [
    "Alert fired within 2 minutes of impact",
    "Root cause identified in 10 minutes",
    "Cache fallback worked as designed",
  ],
  whatWentPoorly: [
    "No cross-team communication about expected traffic spikes",
    "Connection pool auto-scaling was not implemented",
    "Took 5 minutes to acknowledge the alert",
  ],
  actionItems: [
    {
      id: "AI-001",
      description: "Implement connection pool auto-scaling based on queue depth",
      owner: "Alice Chen",
      priority: "P0",
      dueDate: "2025-02-28",
      status: "open",
    },
    {
      id: "AI-002",
      description: "Create marketing-engineering communication channel for campaigns",
      owner: "Bob Martinez",
      priority: "P1",
      dueDate: "2025-03-07",
      status: "open",
    },
  ],
};
Conclusiones clave
La gestión de incidentes es un sistema, no un esfuerzo heroico individual. Diseña las alertas en torno a síntomas visibles para el usuario y tasas de consumo del presupuesto de errores, no a métricas de infraestructura sin procesar. Clasifica los incidentes por severidad para calibrar la respuesta: no todos los problemas requieren convocar a todo el equipo en una sala de guerra.
Asigna roles claros durante los incidentes: el líder del incidente coordina la respuesta, el líder técnico investiga la causa raíz y el líder de comunicaciones mantiene informadas a las partes interesadas. Realiza post-mortems sin culpas que se centren en mejoras sistémicas en lugar de en la responsabilidad individual.
El resultado más importante no es la resolución en sí, sino los elementos de acción que evitan que se repita ese mismo tipo de incidente. Da seguimiento a esos elementos de acción con el mismo rigor con el que se da seguimiento a las funcionalidades de producto.