Canary Deployments: Gradual Rollouts Done Right
Canary deployments shift a small share of traffic to the new version and roll back automatically when error rates spike — how to implement them safely.
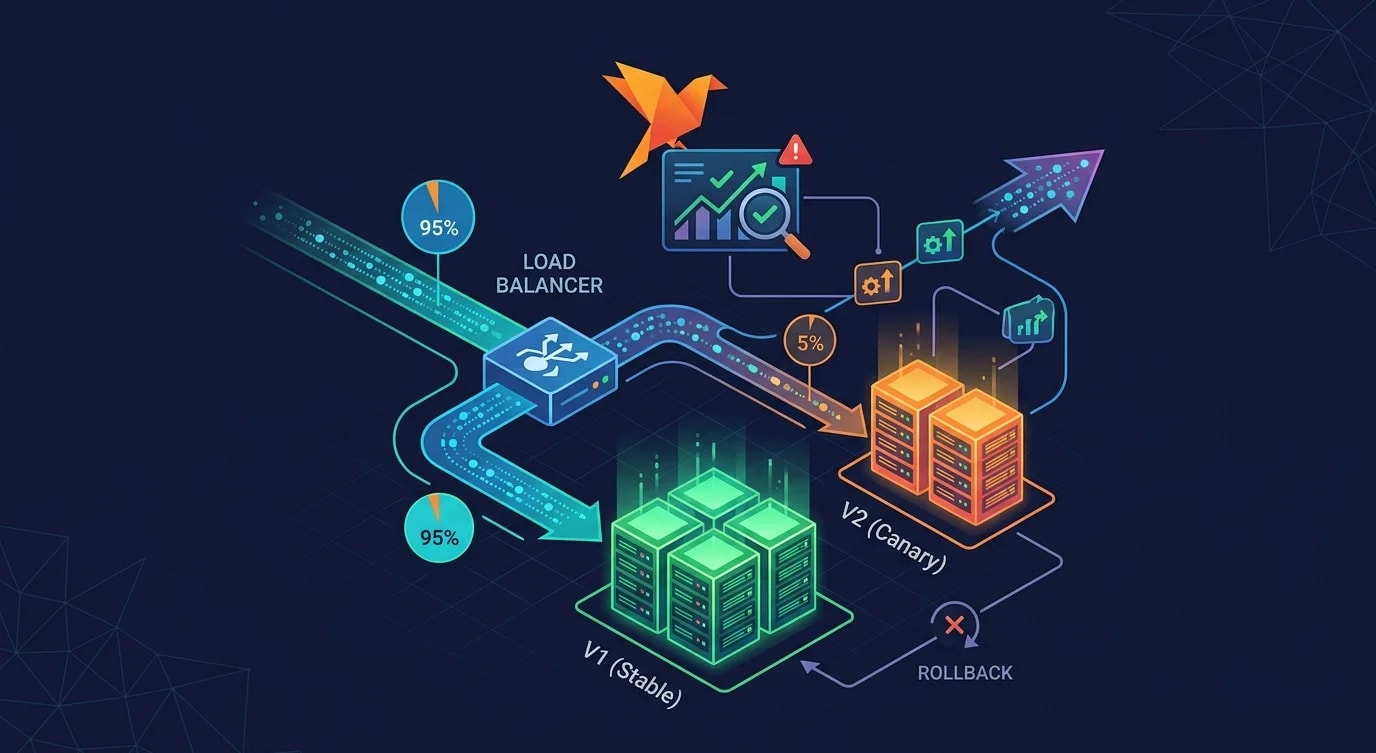
Blue-green deployments switch 100% of traffic at once. That's fine when your smoke tests catch everything, but some bugs only surface under real traffic patterns. Canary deployments take a more cautious approach: route a small percentage of traffic to the new version, monitor key metrics, and gradually increase the percentage — or roll back automatically if something goes wrong.
The Canary Process
A canary deployment follows a progressive rollout: start with 1-5% of traffic, observe for a window, increase the percentage if metrics are healthy, and repeat until 100%.
interface CanaryStage {
  percentage: number;
  durationMinutes: number;
  metrics: MetricCheck[];
}

interface MetricCheck {
  name: string;
  query: string;
  threshold: number;
  comparison: "less_than" | "greater_than";
}

const canaryPlan: CanaryStage[] = [
  {
    percentage: 5,
    durationMinutes: 10,
    metrics: [
      { name: "error_rate", query: "rate(http_5xx[5m])/rate(http_total[5m])", threshold: 0.01, comparison: "less_than" },
      { name: "p99_latency", query: "histogram_quantile(0.99, rate(http_duration_bucket[5m]))", threshold: 2.0, comparison: "less_than" },
    ],
  },
  {
    percentage: 25,
    durationMinutes: 15,
    metrics: [
      { name: "error_rate", query: "rate(http_5xx[5m])/rate(http_total[5m])", threshold: 0.01, comparison: "less_than" },
      { name: "p99_latency", query: "histogram_quantile(0.99, rate(http_duration_bucket[5m]))", threshold: 2.0, comparison: "less_than" },
    ],
  },
  {
    percentage: 50,
    durationMinutes: 15,
    metrics: [
      { name: "error_rate", query: "rate(http_5xx[5m])/rate(http_total[5m])", threshold: 0.01, comparison: "less_than" },
      { name: "p99_latency", query: "histogram_quantile(0.99, rate(http_duration_bucket[5m]))", threshold: 2.0, comparison: "less_than" },
    ],
  },
  { percentage: 100, durationMinutes: 0, metrics: [] },
];
Traffic Splitting with Nginx
Nginx's split_clients directive routes a deterministic percentage of traffic to the canary based on a client identifier.
# ❌ Random routing — same user might flip between versions
upstream canary { server canary-1:3000; server canary-2:3000; }
upstream stable { server stable-1:3000; server stable-2:3000; }

# ✅ Consistent routing — same user always hits the same version
split_clients "$remote_addr$uri" $upstream_variant {
  5%    canary;
  *     stable;
}

upstream canary { server canary-1:3000; server canary-2:3000; }
upstream stable { server stable-1:3000; server stable-2:3000; }

server {
  listen 80;

  location / {
    proxy_pass http://$upstream_variant;
    # Add header so downstream services know which version handled the request
    proxy_set_header X-Deployment-Version $upstream_variant;
  }
}
Automated Metric Comparison
The canary release controller compares metrics between the canary and stable versions. If the canary's error rate or latency is significantly worse, it triggers an automatic rollback.
interface MetricComparison {
  metric: string;
  canaryValue: number;
  stableValue: number;
  degradation: number;
  acceptable: boolean;
}

async function compareCanaryMetrics(
  canarySelector: string,
  stableSelector: string,
  window: string
): Promise<MetricComparison[]> {
  const comparisons: MetricComparison[] = [];

  // Compare error rates
  const canaryErrors = await queryPrometheus(
    `rate(http_errors_total{deployment="${canarySelector}"}[${window}])`
  );
  const stableErrors = await queryPrometheus(
    `rate(http_errors_total{deployment="${stableSelector}"}[${window}])`
  );

  const errorDegradation = stableErrors > 0
    ? (canaryErrors - stableErrors) / stableErrors
    : canaryErrors > 0 ? 1 : 0;

  comparisons.push({
    metric: "error_rate",
    canaryValue: canaryErrors,
    stableValue: stableErrors,
    degradation: errorDegradation,
    acceptable: errorDegradation < 0.10, // Less than 10% worse
  });

  // Compare p99 latency
  const canaryLatency = await queryPrometheus(
    `histogram_quantile(0.99, rate(http_duration_bucket{deployment="${canarySelector}"}[${window}]))`
  );
  const stableLatency = await queryPrometheus(
    `histogram_quantile(0.99, rate(http_duration_bucket{deployment="${stableSelector}"}[${window}]))`
  );

  const latencyDegradation = stableLatency > 0
    ? (canaryLatency - stableLatency) / stableLatency
    : 0;

  comparisons.push({
    metric: "p99_latency",
    canaryValue: canaryLatency,
    stableValue: stableLatency,
    degradation: latencyDegradation,
    acceptable: latencyDegradation < 0.15, // Less than 15% worse
  });

  return comparisons;
}
Kubernetes Canary with Istio
Istio's VirtualService provides fine-grained traffic splitting for Kubernetes deployments.
# Istio VirtualService — 5% canary split
apiVersion: networking.istio.io/v1beta1
kind: VirtualService
metadata:
  name: api-server
spec:
  hosts:
    - api-server
  http:
    - route:
        - destination:
            host: api-server
            subset: stable
          weight: 95
        - destination:
            host: api-server
            subset: canary
          weight: 5

---
apiVersion: networking.istio.io/v1beta1
kind: DestinationRule
metadata:
  name: api-server
spec:
  host: api-server
  subsets:
    - name: stable
      labels:
        version: v1.2.0
    - name: canary
      labels:
        version: v1.3.0
When to Canary vs. Blue-Green
| Criteria              | Canary                        | Blue-Green              |
|-----------------------|-------------------------------|-------------------------|
| Risk tolerance        | Lower (gradual exposure)      | Higher (all-at-once)    |
| Rollback speed        | Fast (reduce to 0%)           | Instant (switch back)   |
| Infrastructure cost   | Minimal (small canary fleet)  | Double (two full envs)  |
| Metric comparison     | Side-by-side during rollout   | Before/after only       |
| Complexity            | Higher (traffic splitting)    | Lower (DNS/LB switch)   |
| Best for              | High-traffic, risk-averse     | Low-traffic, simple      |
Key Takeaways
- Canary deployments reduce blast radius — expose the new version to a small fraction of users before full rollout
- Use consistent routing — the same user should consistently hit the same version during the canary period
- Automate metric comparison — compare canary vs. stable error rates and latencies, not just absolute thresholds
- Define rollback triggers before starting — automatic rollback on metric degradation prevents human hesitation
- Increase traffic gradually — 5% → 25% → 50% → 100% gives multiple observation windows
- Canary catches what testing misses — some bugs only manifest under real traffic patterns and data