Diseño de rotaciones on-call efectivas
Cómo construir rotaciones de guardia que mantengan los sistemas fiables sin quemar al equipo: turnos, escalado, runbooks y respuesta a incidentes.
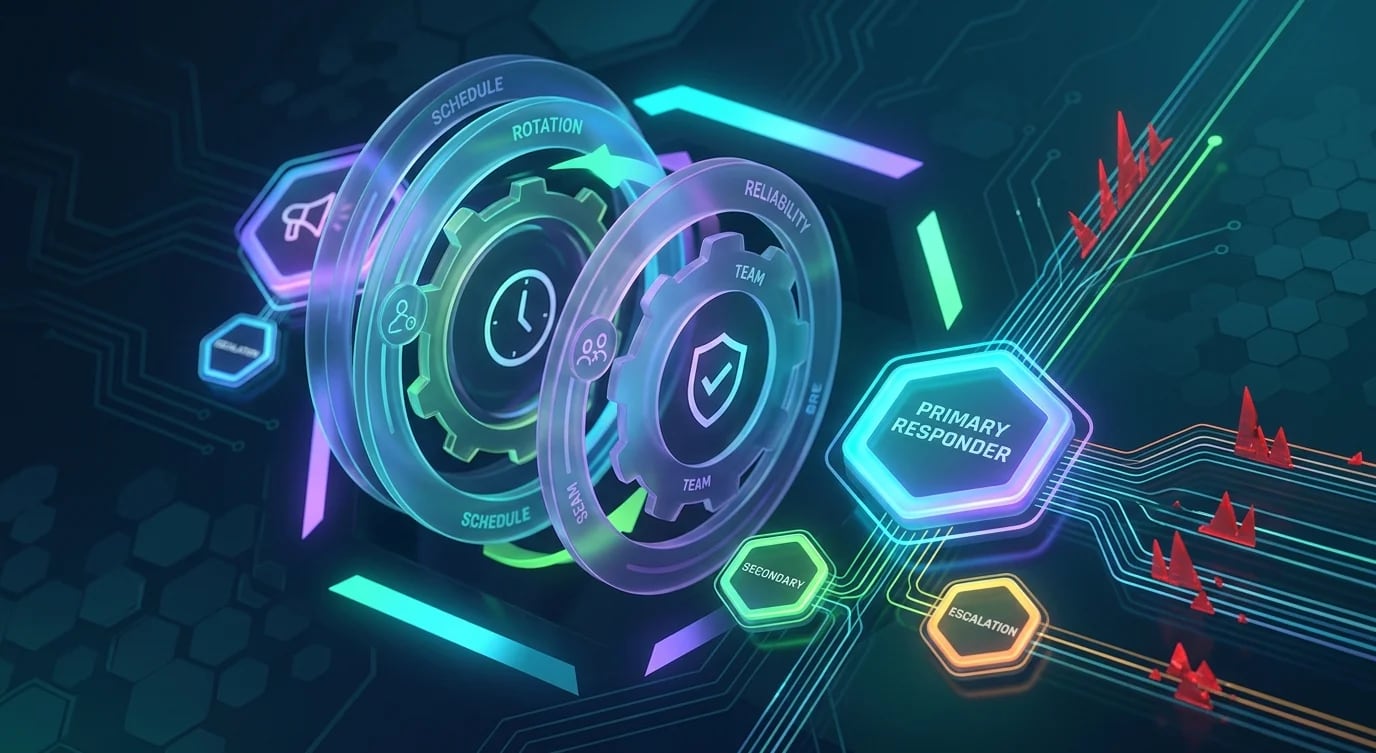
Las rotaciones de guardia son el mecanismo mediante el cual los equipos de ingeniería se mantienen conectados con la confiabilidad de los sistemas que construyen. Una rotación bien diseñada detecta incidentes temprano, los resuelve rápido y distribuye la carga de forma justa. Una mal diseñada quema a los ingenieros, pierde alertas y crea un ciclo en el que siempre responden las mismas dos personas porque nadie más tiene el contexto.
El objetivo no es cero incidentes: es la detección rápida, la resolución eficiente y un sistema que mejora con el tiempo.
Estructura de la rotación
La base es un horario claro con roles definidos. Como mínimo, necesitas un respondedor primario. Para sistemas críticos, agrega un secundario y una ruta de escalamiento.
# Basic rotation structure
rotation:
  primary:
    description: "First responder for all alerts"
    response_sla: "15 minutes to acknowledge, 30 minutes to start investigating"
    shift_length: "1 week"
    handoff_day: "Monday 10 AM (during business hours)"

  secondary:
    description: "Backup if primary doesn't acknowledge within SLA"
    response_sla: "30 minutes to acknowledge"
    escalation_trigger: "Primary doesn't ack within 15 minutes"

  escalation:
    description: "Engineering manager or skip-level"
    trigger: "Neither primary nor secondary responds, OR severity-1 incident"
response_sla: "30 minutes"// ❌ Unfair rotation — same people always on-call
interface BadRotation {
team: string[];
onCall: string[];
}
const badRotation: BadRotation = {
team: ['Alice', 'Bob', 'Carlos', 'Diana', 'Elena'],
onCall: ['Alice', 'Bob'], // Only the two most senior people
// Carlos, Diana, Elena never learn the systems
// Alice and Bob burn out, quit, now nobody knows anything
};
// ✅ Fair rotation — everyone participates
interface OnCallSchedule {
teamMembers: string[];
rotationWeeks: Map<number, { primary: string; secondary: string }>;
excludedDates: Map<string, string>; // person → reason
}
function generateRotation(
members: string[],
weeks: number
): Map<number, { primary: string; secondary: string }> {
const schedule = new Map();
const shuffled = [...members];
for (let week = 0; week < weeks; week++) {
const primaryIdx = week % shuffled.length;
const secondaryIdx = (week + 1) % shuffled.length;
schedule.set(week, {
primary: shuffled[primaryIdx],
secondary: shuffled[secondaryIdx],
});
}
return schedule;
}
// 5-person team = on-call every 5 weeks
// Each shift: 1 week primary, followed by 4 weeks off
const schedule = generateRotation(
['Alice', 'Bob', 'Carlos', 'Diana', 'Elena'],
20
);Calidad de las alertas
El problema más común de las guardias no es tener pocas alertas, sino demasiadas. La fatiga de alertas por señales ruidosas y no accionables hace que los respondedores ignoren incidentes reales.
# Alert hygiene rules
actionable_alerts:
  rule: "Every alert must have a clear action the responder can take"
  test: "If you can't write a runbook entry for it, don't alert on it"

# ❌ Bad alerts — noisy, non-actionable
bad_alerts:
  - "CPU above 60%" # Normal during deployments, causes alert fatigue
  - "Memory usage above 70%" # Expected for JVM applications
  - "404 errors detected" # Some 404s are normal (bots, typos)
  - "Disk usage above 50%" # Way too early, not actionable yet

# ✅ Good alerts — actionable, meaningful
good_alerts:
  - name: "Error rate above 1% for 5 minutes"
    severity: warning
    action: "Check recent deployments, review error logs"

  - name: "P99 latency above 2s for 10 minutes"
    severity: warning
    action: "Check database query performance, review recent changes"

  - name: "Disk usage above 90% and growing"
    severity: critical
    action: "Run log cleanup script, check for runaway log files"

  - name: "Health check failing on 2+ instances for 3 minutes"
    severity: critical
action: "Check instance health, review deployment status, check dependencies"// Measuring alert quality
interface AlertMetrics {
totalAlerts: number;
actionablAlerts: number;
falsePositives: number;
meanTimeToAcknowledge: number; // minutes
meanTimeToResolve: number; // minutes
afterHoursAlerts: number;
alertsPerOnCallShift: number;
}
function assessAlertHealth(metrics: AlertMetrics): string[] {
const issues: string[] = [];
const actionableRate = metrics.actionablAlerts / metrics.totalAlerts;
if (actionableRate < 0.8) {
issues.push(
`Only ${(actionableRate * 100).toFixed(0)}% of alerts are actionable — ` +
`tune thresholds or remove noisy alerts`
);
}
if (metrics.alertsPerOnCallShift > 10) {
issues.push(
`${metrics.alertsPerOnCallShift} alerts per shift is too many — ` +
`target is under 5 per week`
);
}
if (metrics.afterHoursAlerts > metrics.totalAlerts * 0.3) {
issues.push(
`30%+ alerts are after hours — review if they need immediate response ` +
`or can wait until business hours`
);
}
return issues;
}Diseño de runbooks
Un runbook transforma una página de "descúbrelo sobre la marcha" en "sigue estos pasos". Buenos runbooks permiten que cualquier miembro del equipo responda a cualquier alerta, incluso si no construyó el sistema.
## Runbook Template

### Alert: [Alert Name]
**Severity:** Critical / Warning
**Service:** [Service Name]
**Dashboard:** [Link to relevant dashboard]

### What This Means
[1-2 sentences explaining the alert in plain language]

### Immediate Steps
1. Check the [dashboard link] for current status
2. Check recent deployments: `kubectl rollout history deployment/[service]`
3. Review error logs: `kubectl logs -f deployment/[service] --since=10m`
4. [Specific diagnostic command]

### Common Causes and Fixes

**Cause 1: Recent deployment introduced a regression**
- Fix: Roll back → `kubectl rollout undo deployment/[service]`
- Verify: Check error rate returns to baseline within 5 minutes

**Cause 2: Downstream dependency is degraded**
- Check: [dependency status page URL]
- Fix: Enable circuit breaker → [command or config change]
- Verify: Retry requests succeeding after circuit breaker activates

**Cause 3: Resource exhaustion (memory/CPU)**
- Check: `kubectl top pods -n [namespace]`
- Fix: Scale up → `kubectl scale deployment/[service] --replicas=5`
- Verify: Pod resource usage drops below 80%

### Escalation
- If not resolved within 30 minutes, page [Team Lead]
- If customer-facing impact, notify [Incident Commander]

### Post-Incident
- Create incident report within 24 hours
- Update this runbook if resolution differed from documented steps# Script to validate runbook completeness
import os
import re
from pathlib import Path
REQUIRED_SECTIONS = [
"What This Means",
"Immediate Steps",
"Common Causes",
"Escalation",
]
def validate_runbook(filepath: str) -> list[str]:
"""Check that a runbook contains all required sections."""
content = Path(filepath).read_text()
issues = []
for section in REQUIRED_SECTIONS:
if section.lower() not in content.lower():
issues.append(f"Missing section: {section}")
# Check for dashboard link
if "http" not in content and "https" not in content:
issues.append("No dashboard or status page links found")
# Check for concrete commands (backtick blocks)
if content.count("```") < 2:
issues.append("No command examples found — add concrete diagnostic steps")
return issues
# Validate all runbooks
runbook_dir = "docs/runbooks"
for filepath in Path(runbook_dir).glob("*.md"):
issues = validate_runbook(str(filepath))
if issues:
print(f"\n{filepath.name}:")
for issue in issues:
print(f" ⚠ {issue}")
else:
print(f"{filepath.name}: ✓ Complete")Entrega del turno y transferencia de contexto
La entrega entre turnos es donde se pierde el contexto. Entregas estructuradas evitan que el ingeniero entrante empiece a ciegas.
interface OnCallHandoff {
  outgoing: string;
  incoming: string;
  date: string;
  activeIncidents: ActiveIncident[];
  recentChanges: string[];
  watchItems: string[];
  alertsTuned: string[];
}

interface ActiveIncident {
  id: string;
  summary: string;
  status: 'investigating' | 'mitigated' | 'monitoring';
  startedAt: string;
  nextAction: string;
}

// ❌ No handoff — incoming person starts blind
// "Good luck! It was a quiet week." (Narrator: it was not)

// ✅ Structured handoff document
const handoff: OnCallHandoff = {
  outgoing: 'Alice',
  incoming: 'Bob',
  date: '2021-12-20',
  activeIncidents: [
    {
      id: 'INC-1234',
      summary: 'Payment service intermittent 503s during peak hours',
      status: 'monitoring',
      startedAt: '2021-12-18',
      nextAction: 'If 503 rate exceeds 0.5%, scale payment service to 8 replicas',
    },
  ],
  recentChanges: [
    'Deployed auth-service v2.4.0 on Tuesday — new token refresh logic',
    'Database maintenance window Saturday 2-4 AM — failover expected',
  ],
  watchItems: [
    'Disk usage on log aggregator at 82% — cleanup cron runs nightly',
    'New canary deployment for search-service — watch P99 latency',
  ],
  alertsTuned: [
    'Silenced "High memory" on cache nodes — expected after JVM tuning',
  ],
};
Revisión post-incidente
Todo incidente significativo debería producir una revisión post-incidente sin culpas. El objetivo es la mejora sistémica, no asignar culpas.
# Post-incident review template
incident:
  id: "INC-1234"
  severity: "critical"
  duration: "47 minutes"
  customer_impact: "Payment processing unavailable for 12% of users"

timeline:
  - time: "14:02"
    event: "Alert fires: payment-service error rate > 5%"
  - time: "14:07"
    event: "On-call acknowledges, begins investigation"
  - time: "14:15"
    event: "Root cause identified: database connection pool exhausted"
  - time: "14:22"
    event: "Mitigation applied: increased pool size from 20 to 50"
  - time: "14:30"
    event: "Error rate drops below 0.1%"
  - time: "14:49"
    event: "All clear confirmed, incident resolved"

root_cause: |
  A slow query introduced in the morning deployment held connections
  for 30+ seconds. Under peak load, all 20 connections were occupied
  by slow queries, and new requests queued until timeout.

action_items:
  - owner: "Carlos"
    action: "Add query timeout of 5 seconds to database client"
    deadline: "2021-12-24"
  - owner: "Diana"
    action: "Add connection pool utilization alert at 80%"
    deadline: "2021-12-22"
  - owner: "Alice"
    action: "Add slow query logging for queries > 1 second"
    deadline: "2021-12-27"
Conclusiones clave
- Rota la guardia de forma justa en todo el equipo — excluir a personas crea silos de conocimiento y quema a quienes participan
- Apunta a menos de 5 alertas por semana — cada alerta debe ser accionable, con una entrada clara en el runbook
- Escribe runbooks para cada alerta — pasos estructurados permiten que cualquier miembro del equipo responda, no solo quien creó el sistema
- Las entregas estructuradas evitan la pérdida de contexto — documenta incidentes activos, cambios recientes y elementos a vigilar en cada cambio de turno
- Haz revisiones post-incidente sin culpas — enfócate en mejoras sistémicas (timeouts, alertas, runbooks), no en culpar a individuos
- Mide la calidad de las alertas — haz seguimiento de la tasa de accionables, tiempo de reconocimiento y alertas por turno para mejorar la rotación continuamente


